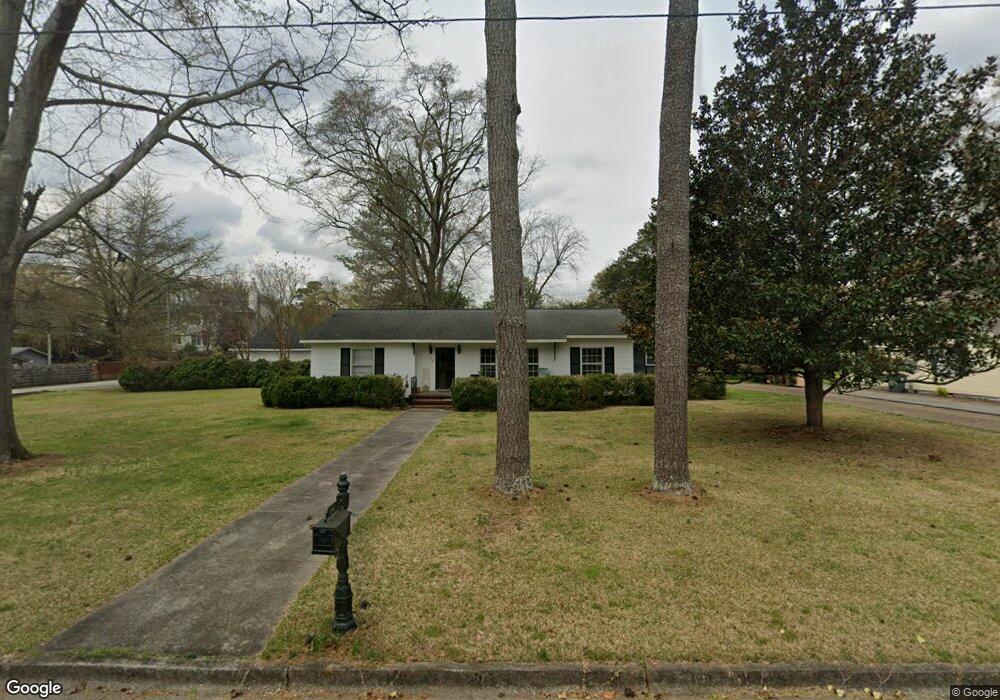
117 Chestnut St Cedartown, GA 30125
Estimated Value: $189,000 - $225,000
3
Beds
2
Baths
1,598
Sq Ft
$126/Sq Ft
Est. Value
About This Home
This home is located at 117 Chestnut St, Cedartown, GA 30125 and is currently estimated at $201,988, approximately $126 per square foot. 117 Chestnut St is a home located in Polk County with nearby schools including Cedar Christian School and Vineyard Harvester Christian Academy.
Ownership History
Date
Name
Owned For
Owner Type
Purchase Details
Closed on
Sep 6, 2023
Sold by
Hubbard Joshua B
Bought by
Smith James
Current Estimated Value
Home Financials for this Owner
Home Financials are based on the most recent Mortgage that was taken out on this home.
Original Mortgage
$140,000
Outstanding Balance
$136,495
Interest Rate
6.96%
Mortgage Type
New Conventional
Estimated Equity
$65,493
Purchase Details
Closed on
Mar 26, 2014
Sold by
Puckett Mary Shannon
Bought by
Hubbard Joshua B
Purchase Details
Closed on
Oct 31, 2007
Sold by
Maree Michael D
Bought by
Puckett M Shannon and Hubbard Joshua B
Home Financials for this Owner
Home Financials are based on the most recent Mortgage that was taken out on this home.
Original Mortgage
$96,436
Interest Rate
6.26%
Mortgage Type
FHA
Purchase Details
Closed on
Jul 13, 2007
Sold by
Not Provided
Bought by
Hubbard Puckett Mary Shannon and Hubbard Joshua B
Purchase Details
Closed on
Dec 17, 1952
Bought by
Hamrick Mrs Mary N
Create a Home Valuation Report for This Property
The Home Valuation Report is an in-depth analysis detailing your home's value as well as a comparison with similar homes in the area
Purchase History
| Date | Buyer | Sale Price | Title Company |
|---|---|---|---|
| Smith James | $175,000 | -- | |
| Hubbard Joshua B | -- | -- | |
| Puckett M Shannon | $97,950 | -- | |
| Hubbard Puckett Mary Shannon | -- | -- | |
| Hamrick Mrs Mary N | -- | -- |
Source: Public Records
Mortgage History
| Date | Status | Borrower | Loan Amount |
|---|---|---|---|
| Open | Smith James | $140,000 | |
| Previous Owner | Puckett M Shannon | $96,436 |
Source: Public Records
Tax History
| Year | Tax Paid | Tax Assessment Tax Assessment Total Assessment is a certain percentage of the fair market value that is determined by local assessors to be the total taxable value of land and additions on the property. | Land | Improvement |
|---|---|---|---|---|
| 2025 | $2,128 | $68,691 | $6,720 | $61,971 |
| 2024 | $2,128 | $68,691 | $6,720 | $61,971 |
| 2023 | $1,173 | $35,203 | $3,840 | $31,363 |
| 2022 | $681 | $30,693 | $3,840 | $26,853 |
| 2021 | $690 | $30,693 | $3,840 | $26,853 |
| 2020 | $691 | $30,693 | $3,840 | $26,853 |
| 2019 | $704 | $28,211 | $3,364 | $24,847 |
| 2018 | $702 | $27,460 | $3,364 | $24,096 |
| 2017 | $693 | $27,460 | $3,364 | $24,096 |
| 2016 | $693 | $27,460 | $3,364 | $24,096 |
| 2015 | $630 | $25,072 | $3,364 | $21,708 |
| 2014 | $634 | $25,072 | $3,364 | $21,708 |
Source: Public Records
Map
Nearby Homes
- 209 N Cave Spring St
- 258 Chestnut St
- 328 Mountain Home Rd
- 601 Mountain Home Rd
- 309 Walnut St
- 126 Marshall St
- 144 Marshall St
- 311 N College St
- 421 Spruce St
- 00 Syble Brannan Pkwy
- 228 Marshall St
- 219 Noyes St
- 519 N College St
- 443 N Cave Spring St
- 208 Highland Ave
- 607 N College St
- 315 Jones St
- 217 E Gibson St
- 382 5th St
- 815 S Main St
- 121 Chestnut St
- 442 Wissahickon Ave
- 446 Wissahickon Ave
- 456 Wissahickon Ave
- 124 Walnut St
- 125 Chestnut St
- 426 Wissahickon Ave
- 136 Walnut St
- 124 Chestnut St
- 132 Walnut St
- 424 Wissahickon Ave
- 433 Wissahickon Ave
- 140 Walnut St
- 422 Wissahickon Ave
- 129 Chestnut St
- 128 Chestnut St
- 445 Wissahickon Ave
- 431 Wissahickon Ave
- 131 Walnut St
- 111 Walnut St
Your Personal Tour Guide
Ask me questions while you tour the home.