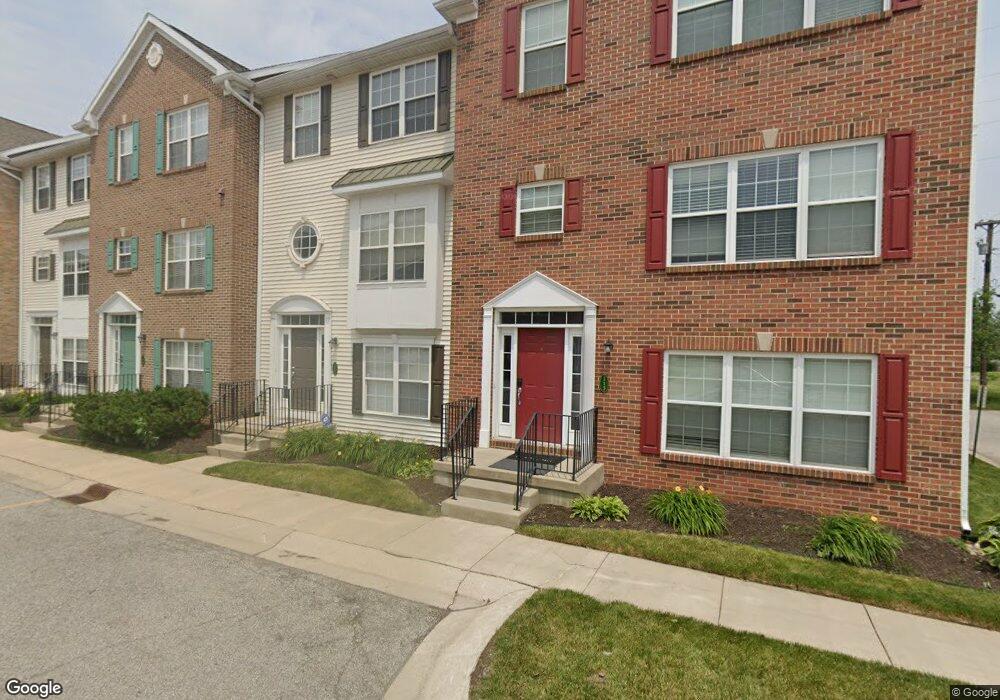
117 Clancey St South Bend, IN 46637
Estimated Value: $300,067 - $385,000
4
Beds
3
Baths
1,919
Sq Ft
$172/Sq Ft
Est. Value
About This Home
This home is located at 117 Clancey St, South Bend, IN 46637 and is currently estimated at $331,017, approximately $172 per square foot. 117 Clancey St is a home located in St. Joseph County with nearby schools including Clay Intermediate Center, Muessel Primary Center, and Jefferson Intermediate Traditional School.
Ownership History
Date
Name
Owned For
Owner Type
Purchase Details
Closed on
Apr 15, 2020
Sold by
Trust No 19821 and First Midwest Bank
Bought by
Rl Clancy 2 Llc
Current Estimated Value
Purchase Details
Closed on
Apr 10, 2007
Sold by
Sb Townhome Developers Llc
Bought by
Standard Bank & Trust Co
Home Financials for this Owner
Home Financials are based on the most recent Mortgage that was taken out on this home.
Original Mortgage
$160,000
Interest Rate
6.19%
Mortgage Type
New Conventional
Create a Home Valuation Report for This Property
The Home Valuation Report is an in-depth analysis detailing your home's value as well as a comparison with similar homes in the area
Home Values in the Area
Average Home Value in this Area
Purchase History
| Date | Buyer | Sale Price | Title Company |
|---|---|---|---|
| Rl Clancy 2 Llc | -- | None Listed On Document | |
| Standard Bank & Trust Co | -- | Meridian Title Corp |
Source: Public Records
Mortgage History
| Date | Status | Borrower | Loan Amount |
|---|---|---|---|
| Previous Owner | Standard Bank & Trust Co | $160,000 |
Source: Public Records
Tax History Compared to Growth
Tax History
| Year | Tax Paid | Tax Assessment Tax Assessment Total Assessment is a certain percentage of the fair market value that is determined by local assessors to be the total taxable value of land and additions on the property. | Land | Improvement |
|---|---|---|---|---|
| 2024 | $6,777 | $116,200 | $5,200 | $111,000 |
| 2023 | $4,337 | $181,900 | $5,200 | $176,700 |
| 2022 | $4,413 | $183,900 | $5,200 | $178,700 |
| 2021 | $4,445 | $231,600 | $6,900 | $224,700 |
| 2020 | $4,362 | $181,400 | $7,400 | $174,000 |
| 2019 | $3,481 | $173,600 | $7,000 | $166,600 |
| 2018 | $3,882 | $162,200 | $6,500 | $155,700 |
| 2017 | $3,548 | $142,900 | $5,700 | $137,200 |
| 2016 | $3,629 | $200,500 | $5,700 | $194,800 |
| 2014 | $4,670 | $183,200 | $4,900 | $178,300 |
Source: Public Records
Map
Nearby Homes
- 125 Myrtle St Unit 20
- 128 Rhode St
- 127 David St
- 53463 Old Woodbridge Ct Unit 6
- 53468 Old Woodbridge Ct Unit 5
- 53434 Old Woodbridge Ct Unit 2
- 52890 Indiana State Route 933 Unit 165
- 248 W Beale St
- 1815 Sherman Ave
- 1029 W Bryan St
- 51670 Prescott Ave
- 51650 Prescott Ave
- 2106 Hollywood Place
- 126 E Cripe St
- 2237 Hollywood Place
- 52912 Francis St
- 1113 Beale St
- 2521 Hollywood Place
- 1958 Berkley Place
- 1922 Berkley Place
- 119 Clancey St
- 115 Clancey St
- 121 Clancey St
- 123 Clancey St
- 127 Clancey St
- 118 Clancey St
- 120 Clancey St
- 122 Clancey St
- 124 Clancey St
- 126 Clancey St
- 129 Clancey St
- 131 Clancey St
- 128 Clancey St
- 130 Clancey St
- 125 Patrick St
- 121 Patrick St
- 123 Patrick St
- 123 Patrick St Unit ID1094961P
- 119 Patrick St
- 127 Patrick St