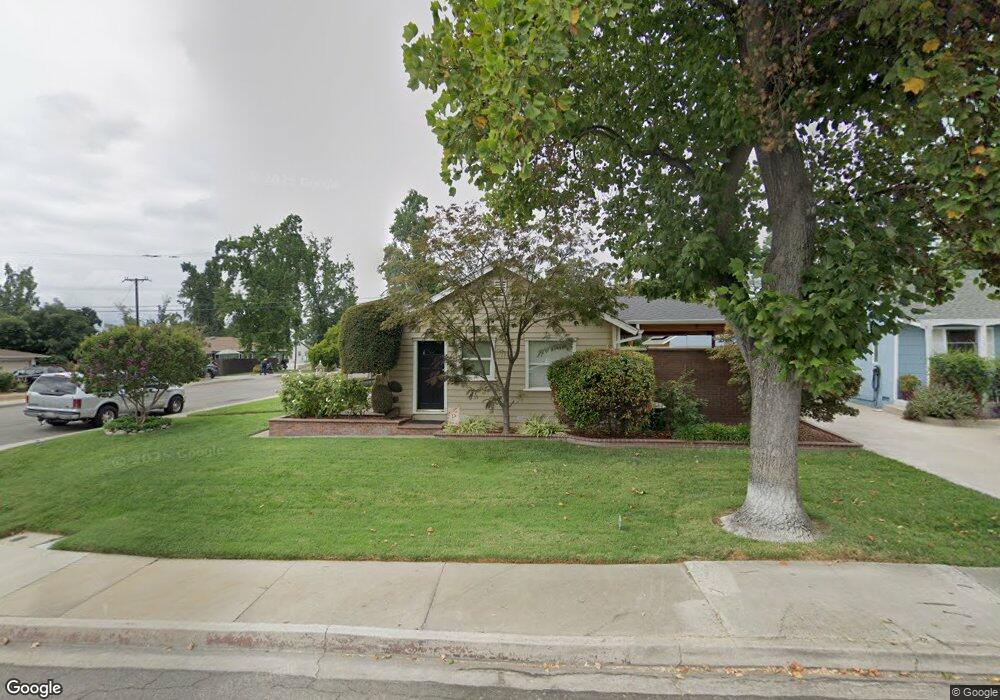
117 Coe St Claremont, CA 91711
Oakmont NeighborhoodEstimated Value: $701,414 - $772,000
About This Home
This home is located at 117 Coe St, Claremont, CA 91711 and is currently estimated at $739,854, approximately $728 per square foot. 117 Coe St is a home located in Los Angeles County with nearby schools including Oakmont Outdoor School, El Roble Intermediate School, and Claremont High School.
Ownership History
We collect this data history from publicly available records. To have your information removed, we recommend requesting removal directly through your county’s website.
Purchase Details
Home Financials for this Owner
Home Financials are based on the most recent Mortgage that was taken out on this home.Purchase Details
Home Financials for this Owner
Home Financials are based on the most recent Mortgage that was taken out on this home.Purchase Details
Home Financials for this Owner
Home Financials are based on the most recent Mortgage that was taken out on this home.Home Values in the Area
Average Home Value in this Area
Purchase History
We collect this data history from publicly available records. To have your information removed, we recommend requesting removal directly through your county’s website.
| Date | Buyer | Sale Price | Title Company |
|---|---|---|---|
| -- | Fidelity National Title | ||
| -- | Landsafe Title | ||
| -- | Landsafe Title | ||
| $152,500 | Southland Title |
Mortgage History
We collect this data history from publicly available records. To have your information removed, we recommend requesting removal directly through your county’s website.
| Date | Status | Borrower | Loan Amount |
|---|---|---|---|
| Closed | $149,000 | ||
| Closed | $146,000 | ||
| Closed | $147,900 |
Tax History
We collect this data history from publicly available records. To have your information removed, we recommend requesting removal directly through your county’s website.
| Year | Tax Paid | Tax Assessment Tax Assessment Total Assessment is a certain percentage of the fair market value that is determined by local assessors to be the total taxable value of land and additions on the property. | Land | Improvement |
|---|---|---|---|---|
| 2025 | $3,606 | $239,050 | $121,015 | $118,035 |
| 2024 | $3,458 | $234,364 | $118,643 | $115,721 |
| 2023 | $3,386 | $229,769 | $116,317 | $113,452 |
| 2022 | $3,325 | $225,265 | $114,037 | $111,228 |
| 2021 | $3,264 | $220,849 | $111,801 | $109,048 |
| 2019 | $3,125 | $214,300 | $108,486 | $105,814 |
| 2018 | $3,001 | $210,099 | $106,359 | $103,740 |
| 2016 | $2,806 | $201,942 | $102,230 | $99,712 |
| 2015 | $2,768 | $198,910 | $100,695 | $98,215 |
| 2014 | $2,754 | $195,015 | $98,723 | $96,292 |
Map
- 267 Olive St
- 433 W Arrow Hwy
- 464 Cinderella Dr
- 587 S College Ave
- 385 Sycamore Ave
- 518 Converse Ave
- 547 Converse Ave
- 587 Sycamore Ave
- 416 Oakdale Dr
- 682 Sycamore Ave
- 640 Sycamore Ave
- 630 Sycamore Ave
- 436 Oakdale Dr
- 4424 San Jose St Unit 3
- 616 Mckenna St Unit 127
- 224 S Mills Ave
- 533 Geneva Ave
- 517 Wayland Ct
- 9133 Camulos Ave
- 4622 San Jose St Unit H
- 365 Saint Bonaventure St
- 378 Springfield St
- 366 Springfield St
- 353 Saint Bonaventure St
- 116 Coe St
- 355 St Bonaventure Ave
- 354 Springfield St
- 378 Saint Bonaventure St
- 406 Springfield St
- 366 Saint Bonaventure St
- 386 Saint Bonaventure St
- 345 Saint Bonaventure St
- 417 Saint Bonaventure St
- 354 Saint Bonaventure St
- 346 Springfield St
- 406 Saint Bonaventure St
- 414 Springfield St
- 346 Saint Bonaventure St
- 333 Saint Bonaventure St
- 429 Saint Bonaventure St
Ask me questions while you tour the home.