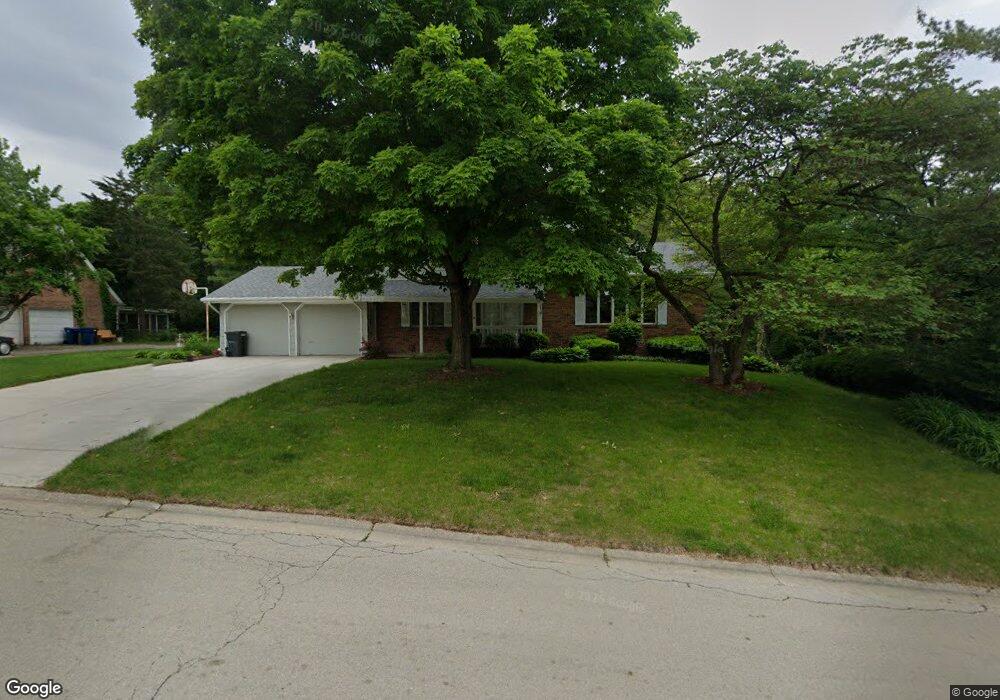
117 Crabapple Ln Morris, IL 60450
Estimated Value: $322,252 - $378,000
4
Beds
2
Baths
2,054
Sq Ft
$174/Sq Ft
Est. Value
About This Home
This home is located at 117 Crabapple Ln, Morris, IL 60450 and is currently estimated at $356,563, approximately $173 per square foot. 117 Crabapple Ln is a home located in Grundy County with nearby schools including White Oak Elementary School, Shabbona Middle School, and Morris Community High School.
Ownership History
Date
Name
Owned For
Owner Type
Purchase Details
Closed on
Apr 15, 2021
Sold by
Mattson Nancy M
Bought by
Mattson Nancy M
Current Estimated Value
Create a Home Valuation Report for This Property
The Home Valuation Report is an in-depth analysis detailing your home's value as well as a comparison with similar homes in the area
Purchase History
| Date | Buyer | Sale Price | Title Company |
|---|---|---|---|
| Mattson Nancy M | -- | None Available |
Source: Public Records
Tax History
| Year | Tax Paid | Tax Assessment Tax Assessment Total Assessment is a certain percentage of the fair market value that is determined by local assessors to be the total taxable value of land and additions on the property. | Land | Improvement |
|---|---|---|---|---|
| 2024 | $7,274 | $87,120 | $20,171 | $66,949 |
| 2023 | $6,818 | $81,657 | $18,906 | $62,751 |
| 2022 | $5,143 | $72,597 | $16,808 | $55,789 |
| 2021 | $4,401 | $62,844 | $14,550 | $48,294 |
| 2020 | $3,950 | $57,001 | $13,197 | $43,804 |
| 2019 | $4,717 | $65,843 | $15,244 | $50,599 |
| 2018 | $4,706 | $65,731 | $15,218 | $50,513 |
| 2017 | $4,705 | $66,002 | $15,281 | $50,721 |
| 2016 | $4,740 | $66,594 | $15,418 | $51,176 |
| 2015 | $4,200 | $64,988 | $15,046 | $49,942 |
| 2014 | $4,249 | $61,752 | $14,297 | $47,455 |
| 2013 | $4,442 | $60,600 | $14,030 | $46,570 |
Source: Public Records
Map
Nearby Homes
- Lot 58 Timber Edge Dr
- 1277 Fremont Ave
- 2099 Kingtree Dr
- 1028 Oakwood Dr
- 1054 Oakwood Dr
- 1094 Oakwood Dr
- 1007 Oakwood Dr
- 1006 Shadow Wood Dr
- 1088 Shadow Wood Dr
- 1800 Kingtree Dr
- 1455 Lake Dr
- 1027 Westwood Dr
- 1058 Westwood Dr
- 1010 Westwood Dr
- 374 Edgewater Dr
- Lot 3,4,5,7,8 Edgewater Dr
- 0000 Lakewood Dr
- 1180 Lakewood Dr
- 109 Doe Cir
- 1539 W Us Route 6
- 701 Briar Ln
- 701 Briar Ln
- 116 Crabapple Ln
- 114 Crabapple Ln
- 118 Crabapple Ln
- 111 Crabapple Ln
- 112 Crabapple Ln
- 709 Briar Ln
- 110 Crabapple Ln
- 111 Sherwood Place
- 702 Briar Ln
- 109 Crabapple Ln
- 604 Briar Ln
- 109 Sherwood Place
- 706 Briar Ln
- 602 Briar Ln
- 601 Briar Ln
- 108 Crabapple Ln
- 711 Briar Ln
- 107 Crabapple Ln
Your Personal Tour Guide
Ask me questions while you tour the home.