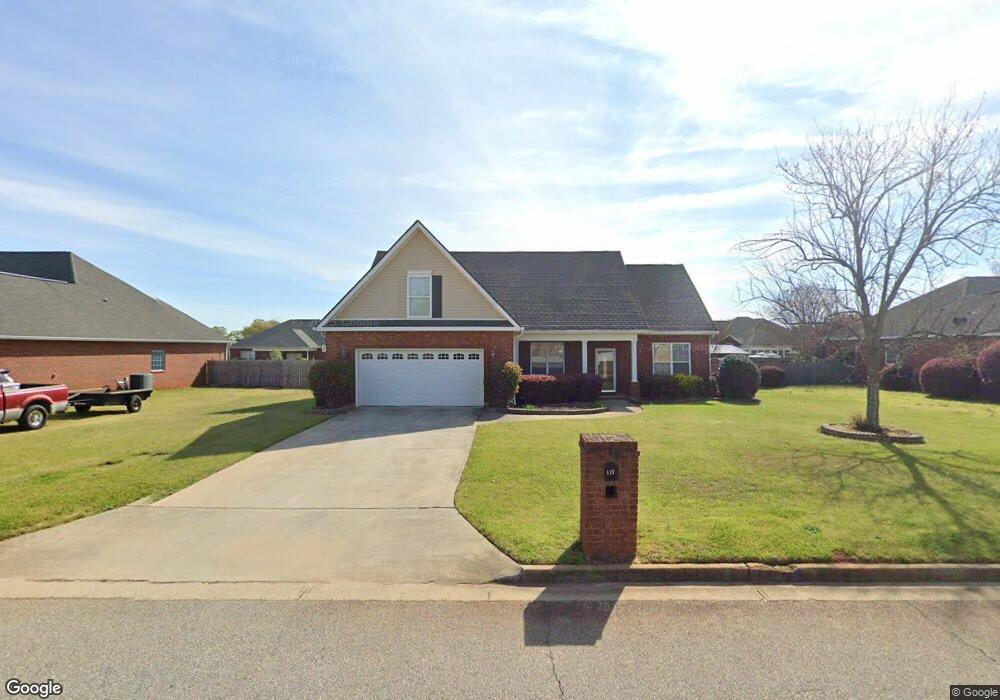
117 Daventry Ln Warner Robins, GA 31088
Estimated Value: $299,000 - $337,000
Studio
--
Bath
2,204
Sq Ft
$144/Sq Ft
Est. Value
About This Home
This home is located at 117 Daventry Ln, Warner Robins, GA 31088 and is currently estimated at $316,674, approximately $143 per square foot. 117 Daventry Ln is a home located in Houston County with nearby schools including Lake Joy Primary School, Lake Joy Elementary School, and Feagin Mill Middle School.
Ownership History
Date
Name
Owned For
Owner Type
Purchase Details
Closed on
Jul 18, 2006
Sold by
C W Williams Homes Llc
Bought by
Jackson Ronnie and Jackson Christine
Current Estimated Value
Home Financials for this Owner
Home Financials are based on the most recent Mortgage that was taken out on this home.
Original Mortgage
$186,000
Interest Rate
6.54%
Mortgage Type
New Conventional
Purchase Details
Closed on
May 10, 2005
Sold by
Jeniar Inc
Bought by
C W Williams Homes Inc
Home Financials for this Owner
Home Financials are based on the most recent Mortgage that was taken out on this home.
Original Mortgage
$146,320
Interest Rate
5.88%
Mortgage Type
Future Advance Clause Open End Mortgage
Purchase Details
Closed on
Jul 6, 2004
Sold by
Highway 41 Llc
Bought by
Jenlar Inc
Create a Home Valuation Report for This Property
The Home Valuation Report is an in-depth analysis detailing your home's value as well as a comparison with similar homes in the area
Home Values in the Area
Average Home Value in this Area
Purchase History
| Date | Buyer | Sale Price | Title Company |
|---|---|---|---|
| Jackson Ronnie | $186,000 | None Available | |
| C W Williams Homes Inc | $26,400 | None Available | |
| Jenlar Inc | $25,000 | -- |
Source: Public Records
Mortgage History
| Date | Status | Borrower | Loan Amount |
|---|---|---|---|
| Previous Owner | Jackson Ronnie | $186,000 | |
| Previous Owner | C W Williams Homes Inc | $146,320 |
Source: Public Records
Tax History
| Year | Tax Paid | Tax Assessment Tax Assessment Total Assessment is a certain percentage of the fair market value that is determined by local assessors to be the total taxable value of land and additions on the property. | Land | Improvement |
|---|---|---|---|---|
| 2024 | $3,600 | $110,000 | $10,000 | $100,000 |
| 2023 | $3,278 | $99,400 | $10,000 | $89,400 |
| 2022 | $2,018 | $87,760 | $10,000 | $77,760 |
| 2021 | $1,735 | $75,040 | $10,000 | $65,040 |
| 2020 | $1,662 | $71,560 | $10,000 | $61,560 |
| 2019 | $1,662 | $71,560 | $10,000 | $61,560 |
| 2018 | $1,662 | $71,560 | $10,000 | $61,560 |
| 2017 | $1,664 | $71,560 | $10,000 | $61,560 |
| 2016 | $1,667 | $71,560 | $10,000 | $61,560 |
| 2015 | -- | $71,560 | $10,000 | $61,560 |
| 2014 | $760 | $71,560 | $10,000 | $61,560 |
| 2013 | $760 | $71,560 | $10,000 | $61,560 |
Source: Public Records
Map
Nearby Homes
- 115 Daventry Ln
- 119 Daventry Ln
- 116 Bromley Way
- 114 Bromley Way
- 118 Bromley Way
- 113 Daventry Ln
- 116 Daventry Ln
- 118 Daventry Ln
- 114 Daventry Ln
- 112 Bromley Way
- 112 Daventry Ln
- 111 Daventry Ln
- 305 Loudon Hill Dr
- 307 Loudon Hill Dr
- 307 Loudon Hill Dr Unit 8
- 110 Bromley Way
- 303 Loudon Hill Dr
- 309 Loudon Hill Dr
- 117 Dovecot Dr
- 117 Bromley Way
Your Personal Tour Guide
Ask me questions while you tour the home.