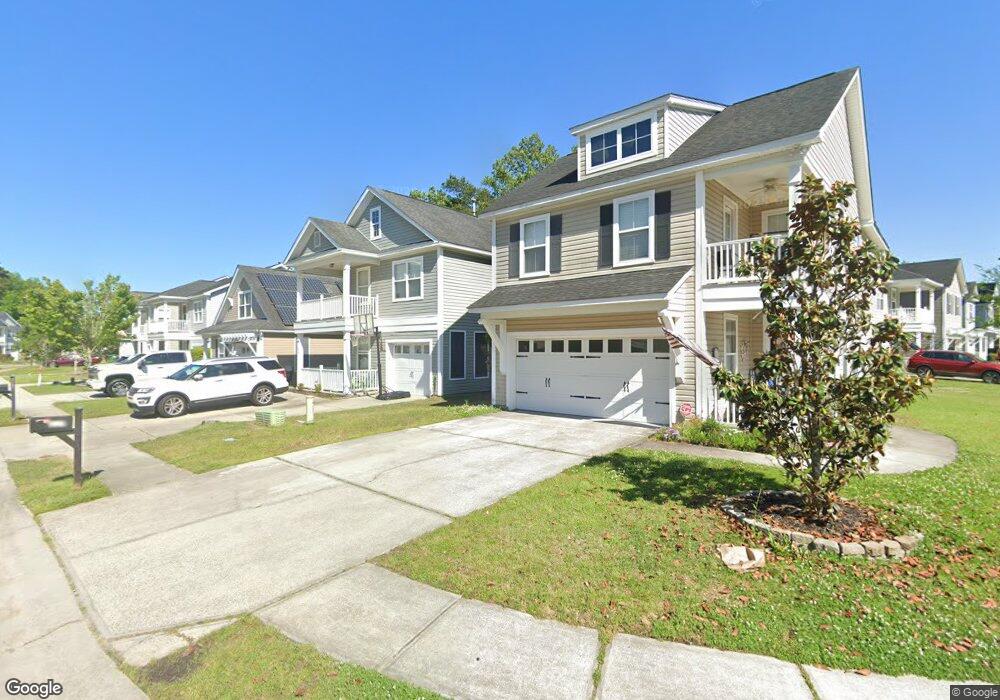
117 Diploma Dr Ladson, SC 29456
Estimated Value: $345,000 - $359,000
3
Beds
3
Baths
2,002
Sq Ft
$175/Sq Ft
Est. Value
About This Home
This home is located at 117 Diploma Dr, Ladson, SC 29456 and is currently estimated at $350,711, approximately $175 per square foot. 117 Diploma Dr is a home located in Dorchester County with nearby schools including Oakbrook Elementary School, Oakbrook Middle School, and Fort Dorchester High School.
Ownership History
Date
Name
Owned For
Owner Type
Purchase Details
Closed on
Mar 6, 2015
Sold by
American Homes 4 Rent Properties Ten Llc
Bought by
Amh 2015-1 Borrower Llc
Current Estimated Value
Purchase Details
Closed on
Oct 29, 2013
Sold by
Waring Carla M and Timmons Carla W
Bought by
American Homes 4 Rent Properties Ten Llc
Purchase Details
Closed on
Jul 27, 2007
Sold by
Sabal Homes At Eagle Run Llc
Bought by
Waring Carla M
Home Financials for this Owner
Home Financials are based on the most recent Mortgage that was taken out on this home.
Original Mortgage
$201,960
Interest Rate
6.71%
Mortgage Type
FHA
Purchase Details
Closed on
Aug 15, 2006
Sold by
Eagle Run Developers Llc
Bought by
Sabal Homes At Eagle Run Llc
Create a Home Valuation Report for This Property
The Home Valuation Report is an in-depth analysis detailing your home's value as well as a comparison with similar homes in the area
Home Values in the Area
Average Home Value in this Area
Purchase History
| Date | Buyer | Sale Price | Title Company |
|---|---|---|---|
| Amh 2015-1 Borrower Llc | -- | -- | |
| American Homes 4 Rent Properties Ten Llc | $150,000 | -- | |
| Waring Carla M | $205,130 | Attorney | |
| Sabal Homes At Eagle Run Llc | $424,200 | None Available |
Source: Public Records
Mortgage History
| Date | Status | Borrower | Loan Amount |
|---|---|---|---|
| Previous Owner | Waring Carla M | $201,960 |
Source: Public Records
Tax History Compared to Growth
Tax History
| Year | Tax Paid | Tax Assessment Tax Assessment Total Assessment is a certain percentage of the fair market value that is determined by local assessors to be the total taxable value of land and additions on the property. | Land | Improvement |
|---|---|---|---|---|
| 2025 | $4,388 | $20,356 | $6,840 | $13,516 |
| 2024 | $4,299 | $20,356 | $6,840 | $13,516 |
| 2023 | $4,299 | $11,692 | $3,000 | $8,692 |
| 2022 | $3,837 | $10,230 | $2,420 | $7,810 |
| 2021 | $3,837 | $10,230 | $2,420 | $7,810 |
| 2020 | $3,719 | $8,890 | $2,100 | $6,790 |
| 2019 | $3,662 | $8,890 | $2,100 | $6,790 |
| 2018 | $3,110 | $8,890 | $2,100 | $6,790 |
| 2017 | $3,101 | $8,890 | $2,100 | $6,790 |
| 2016 | $3,054 | $8,890 | $2,100 | $6,790 |
| 2015 | $3,049 | $8,890 | $2,100 | $6,790 |
| 2014 | $2,997 | $148,148 | $0 | $0 |
| 2013 | -- | $12,080 | $0 | $0 |
Source: Public Records
Map
Nearby Homes
- 124 Diploma Dr
- 419 Equinox Cir
- 108 Equinox Cir
- 193 Chemistry Cir
- 206 Equinox Cir
- 203 Ibis Dr
- 201 Ibis Dr
- 9752 Transplanter Cir
- 701 Professor Dr
- 4504 Winterwood Place
- 3921 Ladson Rd
- 154 Grand Oaks Dr Unit 4102
- 203 Oakmont Ave Unit B
- 9656 Brandishing Rd
- 174 Education Blvd
- 9662 Brandishing Rd
- 209 Grand Oaks Dr Unit 2102
- 5100 Torrey Ln
- 229 Grand Oaks Dr
- 108 Spanish Oaks Ln Unit 4703