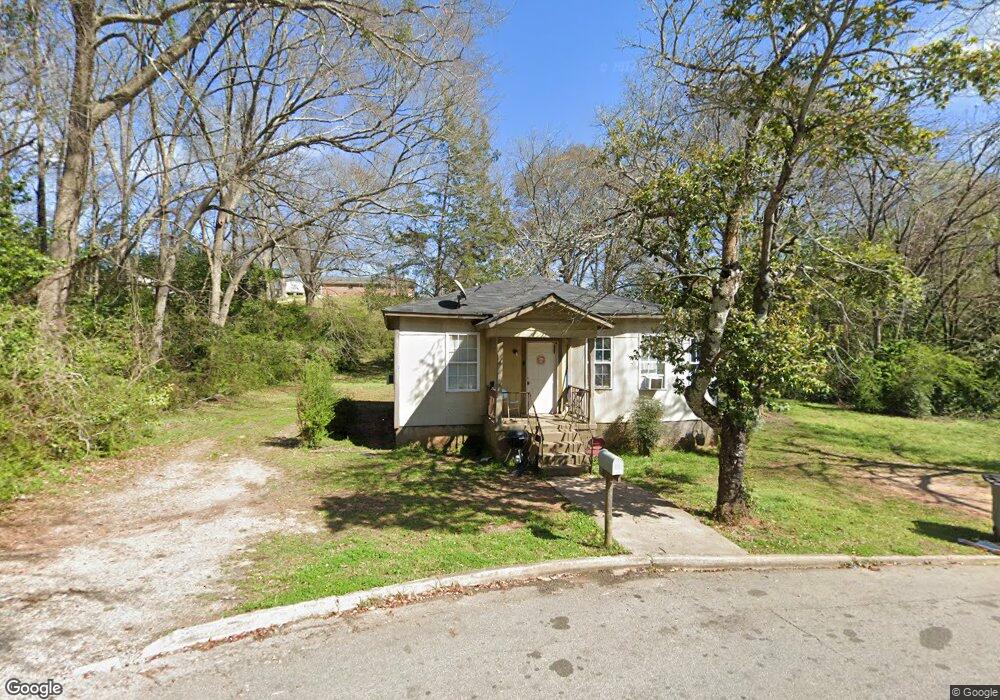
117 Dix St Lagrange, GA 30241
Estimated Value: $70,626 - $76,000
2
Beds
1
Bath
948
Sq Ft
$78/Sq Ft
Est. Value
About This Home
This home is located at 117 Dix St, Lagrange, GA 30241 and is currently estimated at $73,907, approximately $77 per square foot. 117 Dix St is a home located in Troup County with nearby schools including Hollis Hand Elementary School, Franklin Forest Elementary School, and Ethel W. Kight Elementary School.
Ownership History
Date
Name
Owned For
Owner Type
Purchase Details
Closed on
Jan 13, 2023
Sold by
Barlatier Marie
Bought by
Barlatier Marie Flore and Alcindor Bernard C
Current Estimated Value
Purchase Details
Closed on
May 10, 2021
Sold by
Copeland Mary A
Bought by
Barlatier Maria
Purchase Details
Closed on
Sep 4, 1997
Sold by
Pauline Mitchell
Bought by
Joe Cecil Copeland
Purchase Details
Closed on
Sep 3, 1997
Sold by
Skoki Orr Hubby
Bought by
Pauline Mitchell
Purchase Details
Closed on
Aug 16, 1995
Sold by
Moses Mitchell
Bought by
Skoki Orr Hubby
Purchase Details
Closed on
Oct 13, 1992
Sold by
Fannie Ferrell
Bought by
Moses Mitchell
Purchase Details
Closed on
Sep 18, 1979
Sold by
Moses Mitchell
Bought by
Fannie Ferrell
Purchase Details
Closed on
Jun 18, 1979
Sold by
Ferrell Fannie Beasley
Bought by
Moses Mitchell
Purchase Details
Closed on
Jan 1, 1950
Sold by
Fannie Colonel and Fannie Ferrell
Bought by
Ferrell Fannie Beasley
Create a Home Valuation Report for This Property
The Home Valuation Report is an in-depth analysis detailing your home's value as well as a comparison with similar homes in the area
Purchase History
| Date | Buyer | Sale Price | Title Company |
|---|---|---|---|
| Barlatier Marie Flore | -- | -- | |
| Barlatier Maria | $18,000 | -- | |
| Joe Cecil Copeland | $6,800 | -- | |
| Pauline Mitchell | $6,800 | -- | |
| Skoki Orr Hubby | -- | -- | |
| Moses Mitchell | $1,000 | -- | |
| Fannie Ferrell | -- | -- | |
| Moses Mitchell | -- | -- | |
| Ferrell Fannie Beasley | -- | -- |
Source: Public Records
Tax History
| Year | Tax Paid | Tax Assessment Tax Assessment Total Assessment is a certain percentage of the fair market value that is determined by local assessors to be the total taxable value of land and additions on the property. | Land | Improvement |
|---|---|---|---|---|
| 2025 | $427 | $15,640 | $4,800 | $10,840 |
| 2024 | $398 | $14,600 | $4,800 | $9,800 |
| 2023 | $286 | $10,480 | $4,800 | $5,680 |
| 2022 | $201 | $10,160 | $4,800 | $5,360 |
| 2021 | $328 | $10,880 | $3,600 | $7,280 |
| 2020 | $328 | $10,880 | $3,600 | $7,280 |
| 2019 | $302 | $10,016 | $3,616 | $6,400 |
| 2018 | $302 | $10,016 | $3,616 | $6,400 |
| 2017 | $302 | $10,016 | $3,616 | $6,400 |
| 2016 | $301 | $9,996 | $3,616 | $6,380 |
| 2015 | $302 | $9,996 | $3,616 | $6,380 |
| 2014 | $292 | $9,660 | $3,616 | $6,044 |
| 2013 | -- | $13,072 | $3,616 | $9,456 |
Source: Public Records
Map
Nearby Homes
Your Personal Tour Guide
Ask me questions while you tour the home.