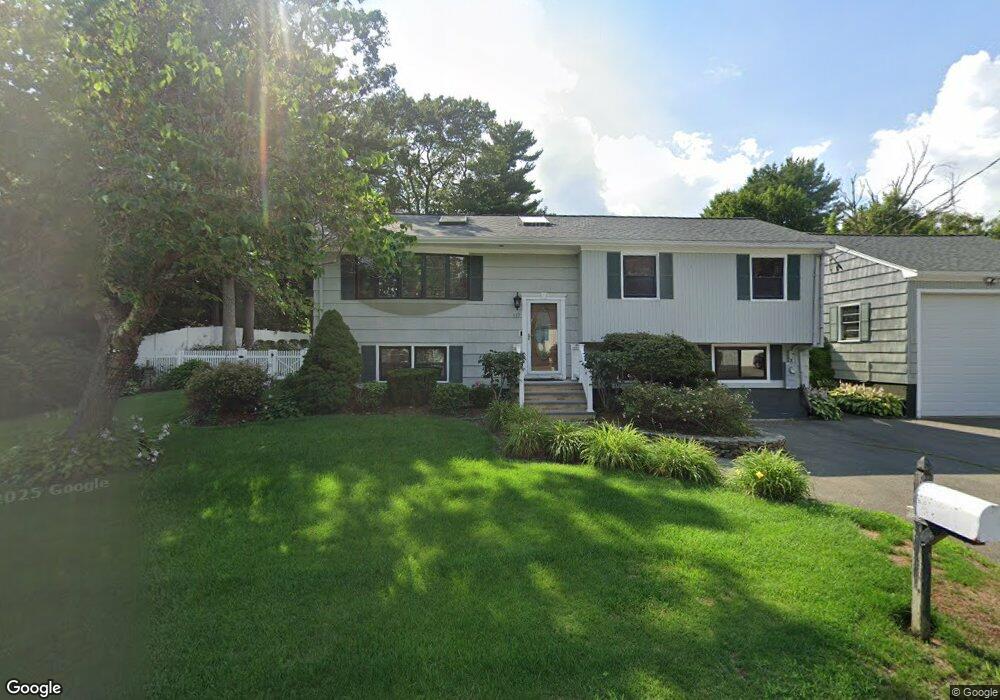
117 Duncan Rd Stoughton, MA 02072
Estimated Value: $542,000 - $626,009
3
Beds
1
Bath
1,529
Sq Ft
$383/Sq Ft
Est. Value
About This Home
This home is located at 117 Duncan Rd, Stoughton, MA 02072 and is currently estimated at $586,002, approximately $383 per square foot. 117 Duncan Rd is a home located in Norfolk County with nearby schools including South Elementary School, O'Donnell Middle School, and Stoughton High School.
Ownership History
Date
Name
Owned For
Owner Type
Purchase Details
Closed on
Oct 31, 2007
Sold by
Lasalle Bk
Bought by
Lawrence Anna and Lawrence Ivan
Current Estimated Value
Home Financials for this Owner
Home Financials are based on the most recent Mortgage that was taken out on this home.
Original Mortgage
$256,500
Interest Rate
6.43%
Mortgage Type
Purchase Money Mortgage
Purchase Details
Closed on
Jun 25, 2007
Sold by
Laguerre Antoine E and Lasalle Bank Na
Bought by
Lasalle Bk
Purchase Details
Closed on
Dec 30, 2004
Sold by
Morris Maribel
Bought by
Laguerre Antoine E
Home Financials for this Owner
Home Financials are based on the most recent Mortgage that was taken out on this home.
Original Mortgage
$304,000
Interest Rate
5.73%
Mortgage Type
Purchase Money Mortgage
Purchase Details
Closed on
Nov 30, 2001
Sold by
Cogan John D and Cogan Christine M
Bought by
Morris Maribel
Create a Home Valuation Report for This Property
The Home Valuation Report is an in-depth analysis detailing your home's value as well as a comparison with similar homes in the area
Home Values in the Area
Average Home Value in this Area
Purchase History
| Date | Buyer | Sale Price | Title Company |
|---|---|---|---|
| Lawrence Anna | $270,000 | -- | |
| Lawrence Anna | $270,000 | -- | |
| Lasalle Bk | $306,000 | -- | |
| Lasalle Bk | $306,000 | -- | |
| Laguerre Antoine E | $380,000 | -- | |
| Laguerre Antoine E | $380,000 | -- | |
| Morris Maribel | $300,000 | -- | |
| Morris Maribel | $300,000 | -- |
Source: Public Records
Mortgage History
| Date | Status | Borrower | Loan Amount |
|---|---|---|---|
| Open | Morris Maribel | $250,290 | |
| Closed | Lawrence Anna | $256,500 | |
| Previous Owner | Laguerre Antoine E | $304,000 | |
| Previous Owner | Laguerre Antoine E | $76,000 |
Source: Public Records
Tax History
| Year | Tax Paid | Tax Assessment Tax Assessment Total Assessment is a certain percentage of the fair market value that is determined by local assessors to be the total taxable value of land and additions on the property. | Land | Improvement |
|---|---|---|---|---|
| 2025 | $6,743 | $544,700 | $227,900 | $316,800 |
| 2024 | $6,556 | $515,000 | $208,200 | $306,800 |
| 2023 | $6,324 | $466,700 | $190,200 | $276,500 |
| 2022 | $6,205 | $430,600 | $183,000 | $247,600 |
| 2021 | $5,915 | $391,700 | $161,500 | $230,200 |
| 2020 | $5,703 | $383,000 | $161,500 | $221,500 |
| 2019 | $6,105 | $398,000 | $161,500 | $236,500 |
| 2018 | $5,338 | $360,400 | $154,300 | $206,100 |
| 2017 | $5,116 | $353,100 | $152,500 | $200,600 |
| 2016 | $4,909 | $327,900 | $138,200 | $189,700 |
| 2015 | $4,852 | $320,700 | $131,000 | $189,700 |
| 2014 | $5,018 | $318,800 | $120,200 | $198,600 |
Source: Public Records
Map
Nearby Homes
Your Personal Tour Guide
Ask me questions while you tour the home.