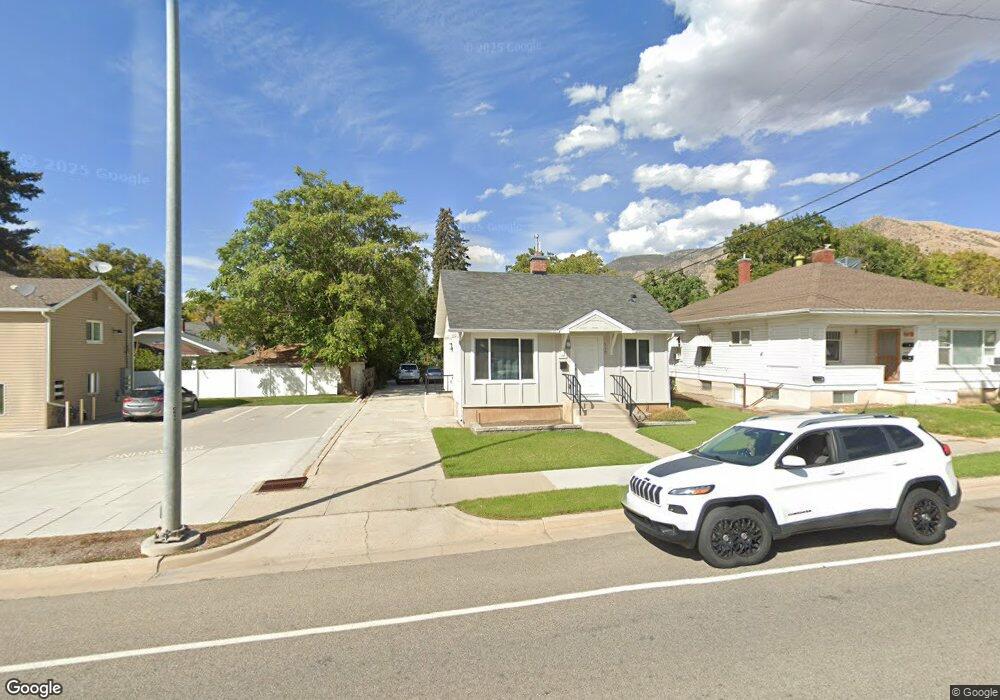
117 E 200 S Brigham City, UT 84302
Estimated Value: $292,000 - $325,000
3
Beds
1
Bath
1,404
Sq Ft
$216/Sq Ft
Est. Value
About This Home
This home is located at 117 E 200 S, Brigham City, UT 84302 and is currently estimated at $303,036, approximately $215 per square foot. 117 E 200 S is a home located in Box Elder County with nearby schools including Golden Spike Elementary, Box Elder Middle School, and Adele C. Young Intermediate School.
Ownership History
Date
Name
Owned For
Owner Type
Purchase Details
Closed on
Apr 12, 2023
Sold by
Simcox Brian H and Simcox Britt S
Bought by
Brian And Britt Simcox Trust and Simcox
Current Estimated Value
Purchase Details
Closed on
Jul 6, 2011
Sold by
Bac Home Loans Servicing Lp
Bought by
Simcox Brian H and Simcox Britt S
Purchase Details
Closed on
Jun 22, 2010
Sold by
Lippold Jacob M and Lippold Kellie S
Bought by
Bac Home Loans Servicing Lp and Countrywide Home Loans Servicing Lp
Purchase Details
Closed on
Apr 22, 2008
Sold by
Hammer Devon K and Hammer Julie T
Bought by
Lippold Jacob M and Lippold Kellie S
Home Financials for this Owner
Home Financials are based on the most recent Mortgage that was taken out on this home.
Original Mortgage
$107,040
Interest Rate
5.8%
Mortgage Type
New Conventional
Create a Home Valuation Report for This Property
The Home Valuation Report is an in-depth analysis detailing your home's value as well as a comparison with similar homes in the area
Purchase History
| Date | Buyer | Sale Price | Title Company |
|---|---|---|---|
| Brian And Britt Simcox Trust | -- | None Listed On Document | |
| Simcox Brian H | -- | First American Title | |
| Bac Home Loans Servicing Lp | $94,275 | -- | |
| Lippold Jacob M | -- | -- |
Source: Public Records
Mortgage History
| Date | Status | Borrower | Loan Amount |
|---|---|---|---|
| Previous Owner | Lippold Jacob M | $107,040 |
Source: Public Records
Tax History
| Year | Tax Paid | Tax Assessment Tax Assessment Total Assessment is a certain percentage of the fair market value that is determined by local assessors to be the total taxable value of land and additions on the property. | Land | Improvement |
|---|---|---|---|---|
| 2025 | $1,426 | $245,163 | $103,750 | $141,413 |
| 2024 | $1,221 | $235,153 | $98,750 | $136,403 |
| 2023 | $1,224 | $241,311 | $93,750 | $147,561 |
| 2022 | $1,254 | $229,864 | $38,750 | $191,114 |
| 2021 | $943 | $136,596 | $38,750 | $97,846 |
| 2020 | $841 | $136,596 | $38,750 | $97,846 |
| 2019 | $797 | $68,937 | $21,313 | $47,624 |
| 2018 | $730 | $62,725 | $21,313 | $41,412 |
| 2017 | $587 | $87,415 | $16,500 | $57,415 |
| 2016 | $619 | $46,575 | $16,500 | $30,075 |
| 2015 | $587 | $43,841 | $16,500 | $27,341 |
| 2014 | $587 | $42,539 | $16,500 | $26,039 |
| 2013 | -- | $42,539 | $16,500 | $26,039 |
Source: Public Records
Map
Nearby Homes
Your Personal Tour Guide
Ask me questions while you tour the home.