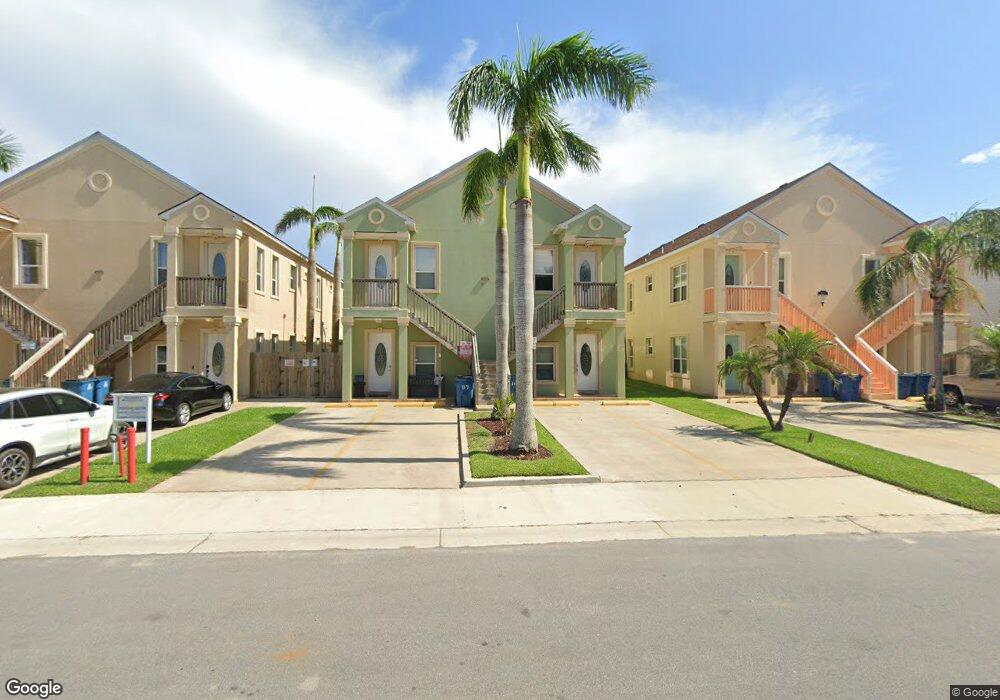
117 E Lantana St Unit B-2 South Padre Island, TX 78597
Estimated Value: $301,664 - $517,000
2
Beds
2
Baths
1,119
Sq Ft
$345/Sq Ft
Est. Value
About This Home
This home is located at 117 E Lantana St Unit B-2, South Padre Island, TX 78597 and is currently estimated at $385,666, approximately $344 per square foot. 117 E Lantana St Unit B-2 is a home located in Cameron County with nearby schools including Garriga Elementary School, Derry Elementary School, and Port Isabel Junior High School.
Ownership History
Date
Name
Owned For
Owner Type
Purchase Details
Closed on
Mar 21, 2022
Sold by
David Loia
Bought by
Ddjj Tx One Llc
Current Estimated Value
Purchase Details
Closed on
Sep 8, 2021
Sold by
Arlon Springston Brett
Bought by
Loia David
Purchase Details
Closed on
May 19, 2010
Sold by
Fannie Mae
Bought by
Springston Brett Arlan
Home Financials for this Owner
Home Financials are based on the most recent Mortgage that was taken out on this home.
Original Mortgage
$144,000
Interest Rate
5.14%
Mortgage Type
New Conventional
Purchase Details
Closed on
May 8, 2006
Sold by
Erickson Jeffrey and Hirn Ronald
Bought by
Esparrago Mary M
Home Financials for this Owner
Home Financials are based on the most recent Mortgage that was taken out on this home.
Original Mortgage
$18,990
Interest Rate
7%
Mortgage Type
Credit Line Revolving
Create a Home Valuation Report for This Property
The Home Valuation Report is an in-depth analysis detailing your home's value as well as a comparison with similar homes in the area
Home Values in the Area
Average Home Value in this Area
Purchase History
| Date | Buyer | Sale Price | Title Company |
|---|---|---|---|
| Ddjj Tx One Llc | -- | None Listed On Document | |
| Loia David | -- | Hay Legal Group Pllc | |
| Springston Brett Arlan | -- | Sierra Title Co | |
| Esparrago Mary M | -- | None Available |
Source: Public Records
Mortgage History
| Date | Status | Borrower | Loan Amount |
|---|---|---|---|
| Previous Owner | Springston Brett Arlan | $144,000 | |
| Previous Owner | Esparrago Mary M | $18,990 | |
| Previous Owner | Esparrago Mary M | $151,920 |
Source: Public Records
Tax History Compared to Growth
Tax History
| Year | Tax Paid | Tax Assessment Tax Assessment Total Assessment is a certain percentage of the fair market value that is determined by local assessors to be the total taxable value of land and additions on the property. | Land | Improvement |
|---|---|---|---|---|
| 2025 | $4,898 | $316,692 | $56,250 | $260,442 |
| 2024 | $4,898 | $300,000 | $56,250 | $243,750 |
| 2023 | $5,312 | $309,873 | $56,250 | $253,623 |
| 2022 | $5,587 | $294,858 | $43,750 | $251,108 |
| 2021 | $3,625 | $180,268 | $32,813 | $147,455 |
| 2020 | $2,916 | $143,996 | $32,813 | $111,183 |
| 2019 | $2,966 | $143,658 | $31,250 | $112,408 |
| 2018 | $2,990 | $144,883 | $31,250 | $113,633 |
| 2017 | $2,992 | $146,109 | $31,250 | $114,859 |
| 2016 | $3,017 | $147,334 | $31,250 | $116,084 |
| 2015 | $2,990 | $148,559 | $31,250 | $117,309 |
Source: Public Records
Map
Nearby Homes
- 117 E Lantana St Unit 12 (B4)
- 120 E Huisache St Unit a
- 120A E Huisache St Unit A
- 129 E Lantana St Unit 3
- 128 E Lantana St Unit 13B
- 111 E Oleander St Unit A
- 111A E Oleander St
- 125 E Huisache St Unit A, B & C
- 105A & 105B E Oleander St
- 133 E Lantana St Unit 102
- 133 E Lantana St Unit 103
- 105 E Oleander St Unit A&B
- 114A E Mesquite St
- Lot 42 Tract 25 Unit 42
- - Abst 260 Unit Lot 1 Block 2
- WAUGH Abstract 260 Unit 1
- Lot 3 Other
- Lot 3 Other Unit 3
- 4909 Padre Blvd Unit 4,5,6
- 0 Gulf Blvd
- 117 E Lantana St Unit ID1255577P
- 117 E Lantana St Unit 8
- 117 E Lantana St Unit 7
- 117 E Lantana St Unit 10
- 117 E Lantana St
- 117 E Lantana St Unit 12
- 117 E Lantana St Unit 11
- 117 E Lantana St Unit 5
- 117 E Lantana St Unit 9
- 117 E Lantana St Unit 6
- 119 E Lantana St Unit 11
- 115 E Lantana St Unit 2
- 115 E Lantana St
- 115 E Lantana St Unit 4
- 115 E Lantana St Unit 3
- 115 E Lantana St Unit 3
- 115 E Lantana St Unit 1
- 121 E Lantana St
- 121 E Lantana St Unit A
- 121A E Lantana St