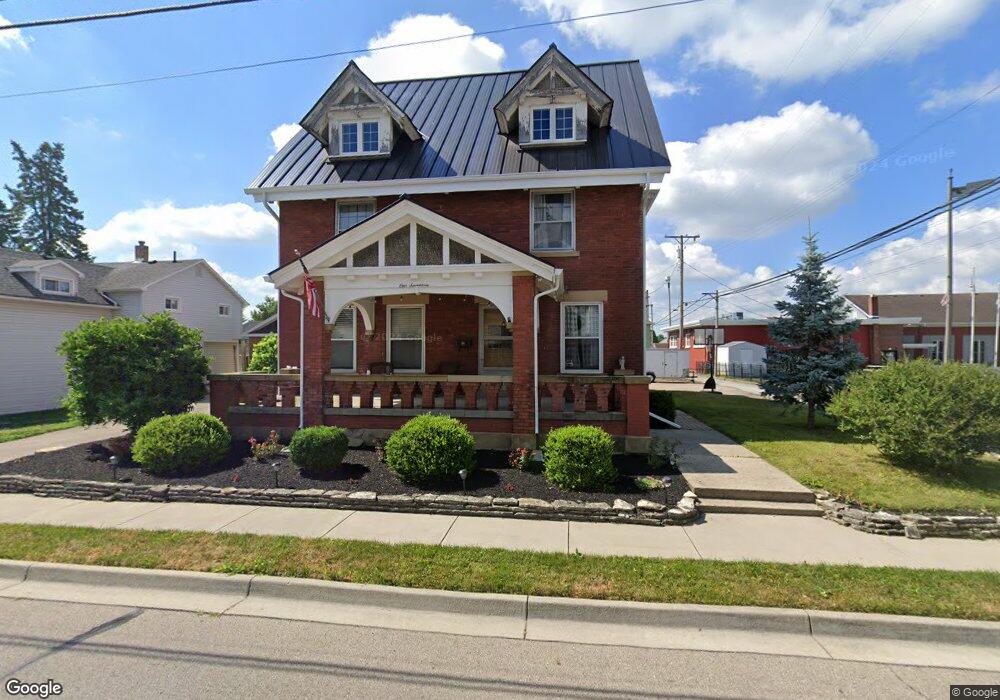
117 E Walnut St Covington, OH 45318
Estimated Value: $261,000 - $266,242
4
Beds
2
Baths
2,732
Sq Ft
$97/Sq Ft
Est. Value
About This Home
This home is located at 117 E Walnut St, Covington, OH 45318 and is currently estimated at $264,311, approximately $96 per square foot. 117 E Walnut St is a home located in Miami County with nearby schools including Covington Elementary/Junior High School, Covington Junior High School, and Covington High School.
Ownership History
Date
Name
Owned For
Owner Type
Purchase Details
Closed on
Mar 31, 2022
Sold by
Hagan Michael T and Hagan Kimberly A
Bought by
Kloecker Michael and Kloecker Plyaphat
Current Estimated Value
Home Financials for this Owner
Home Financials are based on the most recent Mortgage that was taken out on this home.
Original Mortgage
$110,000
Outstanding Balance
$102,773
Interest Rate
4.67%
Mortgage Type
Balloon
Estimated Equity
$161,538
Purchase Details
Closed on
May 31, 2011
Sold by
Fullerton Lois I
Bought by
Hagan Michael T and Hagan Kimberly A
Purchase Details
Closed on
Jan 1, 1990
Bought by
Fullerton Lois I
Create a Home Valuation Report for This Property
The Home Valuation Report is an in-depth analysis detailing your home's value as well as a comparison with similar homes in the area
Home Values in the Area
Average Home Value in this Area
Purchase History
| Date | Buyer | Sale Price | Title Company |
|---|---|---|---|
| Kloecker Michael | $42,000 | Mantica Christopher J | |
| Hagan Michael T | $55,000 | -- | |
| Fullerton Lois I | -- | -- |
Source: Public Records
Mortgage History
| Date | Status | Borrower | Loan Amount |
|---|---|---|---|
| Open | Kloecker Michael | $110,000 | |
| Closed | Hagan Michael T | $0 |
Source: Public Records
Tax History
| Year | Tax Paid | Tax Assessment Tax Assessment Total Assessment is a certain percentage of the fair market value that is determined by local assessors to be the total taxable value of land and additions on the property. | Land | Improvement |
|---|---|---|---|---|
| 2025 | $2,729 | $83,620 | $13,020 | $70,600 |
| 2024 | $2,729 | $53,700 | $14,110 | $39,590 |
| 2023 | $2,011 | $53,700 | $14,110 | $39,590 |
| 2022 | $2,052 | $53,700 | $14,110 | $39,590 |
| 2021 | $1,703 | $41,300 | $10,850 | $30,450 |
| 2020 | $1,707 | $41,300 | $10,850 | $30,450 |
| 2019 | $2,091 | $50,370 | $10,850 | $39,520 |
| 2018 | $1,310 | $31,470 | $8,440 | $23,030 |
| 2017 | $1,333 | $31,470 | $8,440 | $23,030 |
| 2016 | $1,317 | $31,470 | $8,440 | $23,030 |
| 2015 | $974 | $24,260 | $8,120 | $16,140 |
| 2014 | $974 | $24,260 | $8,120 | $16,140 |
| 2013 | $940 | $24,260 | $8,120 | $16,140 |
Source: Public Records
Map
Nearby Homes
Your Personal Tour Guide
Ask me questions while you tour the home.