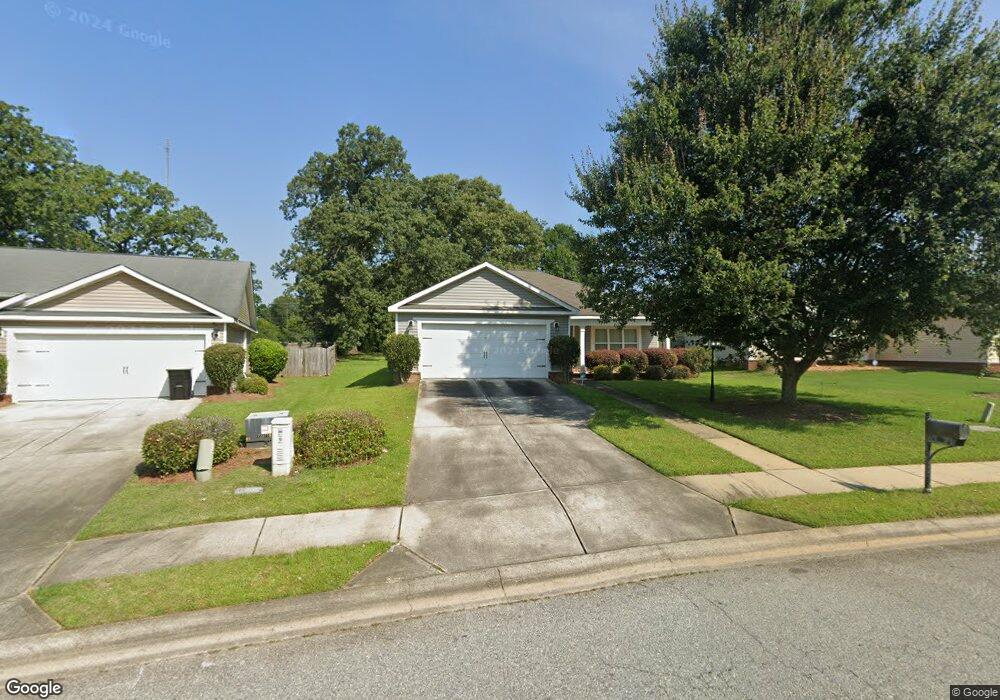
117 Edgarton Way Bonaire, GA 31005
Estimated Value: $215,000 - $236,000
3
Beds
2
Baths
1,264
Sq Ft
$176/Sq Ft
Est. Value
About This Home
This home is located at 117 Edgarton Way, Bonaire, GA 31005 and is currently estimated at $222,405, approximately $175 per square foot. 117 Edgarton Way is a home located in Houston County with nearby schools including Bonaire Elementary School, Bonaire Middle School, and Warner Robins High School.
Ownership History
Date
Name
Owned For
Owner Type
Purchase Details
Closed on
Jul 30, 2010
Sold by
C W Williams Homes & Neighborhoods Inc
Bought by
Huddleston Michael T
Current Estimated Value
Home Financials for this Owner
Home Financials are based on the most recent Mortgage that was taken out on this home.
Original Mortgage
$119,293
Outstanding Balance
$79,658
Interest Rate
4.74%
Mortgage Type
FHA
Estimated Equity
$142,747
Purchase Details
Closed on
Sep 5, 2008
Sold by
C W Williams Homes Inc
Bought by
C W Williams Homes & Neighborhoods Inc
Home Financials for this Owner
Home Financials are based on the most recent Mortgage that was taken out on this home.
Original Mortgage
$94,500
Interest Rate
6.61%
Mortgage Type
Purchase Money Mortgage
Purchase Details
Closed on
Aug 8, 2006
Sold by
Old Hawkinsville Road Llc
Bought by
C W Williams Homes Inc
Create a Home Valuation Report for This Property
The Home Valuation Report is an in-depth analysis detailing your home's value as well as a comparison with similar homes in the area
Home Values in the Area
Average Home Value in this Area
Purchase History
| Date | Buyer | Sale Price | Title Company |
|---|---|---|---|
| Huddleston Michael T | $120,900 | None Available | |
| C W Williams Homes & Neighborhoods Inc | $25,000 | None Available | |
| C W Williams Homes Inc | $19,100 | -- |
Source: Public Records
Mortgage History
| Date | Status | Borrower | Loan Amount |
|---|---|---|---|
| Open | Huddleston Michael T | $119,293 | |
| Previous Owner | C W Williams Homes & Neighborhoods Inc | $94,500 |
Source: Public Records
Tax History Compared to Growth
Tax History
| Year | Tax Paid | Tax Assessment Tax Assessment Total Assessment is a certain percentage of the fair market value that is determined by local assessors to be the total taxable value of land and additions on the property. | Land | Improvement |
|---|---|---|---|---|
| 2024 | $2,291 | $71,400 | $12,000 | $59,400 |
| 2023 | $2,254 | $69,760 | $12,000 | $57,760 |
| 2022 | $1,205 | $54,400 | $10,000 | $44,400 |
| 2021 | $1,104 | $49,760 | $10,000 | $39,760 |
| 2020 | $1,012 | $45,560 | $10,000 | $35,560 |
| 2019 | $1,012 | $45,560 | $10,000 | $35,560 |
| 2018 | $1,012 | $45,560 | $10,000 | $35,560 |
| 2017 | $1,013 | $45,560 | $10,000 | $35,560 |
| 2016 | $1,015 | $45,560 | $10,000 | $35,560 |
| 2015 | -- | $45,560 | $10,000 | $35,560 |
| 2014 | -- | $47,360 | $10,000 | $37,360 |
| 2013 | -- | $47,360 | $10,000 | $37,360 |
Source: Public Records
Map
Nearby Homes
- 204 Thornton Dr
- 308 Piedmont Ln
- 307 Apalachee Way
- 100 Huxley Terrace
- 100 Deerwood Dr
- 104 Old Perry Rd
- 107 Shadowood Dr
- 206 Picketts Mill Ct
- 300 Rustic Live Oak Trail
- 400 Rustic Live Oak Trail
- 216 Rustic Live Oak Trail
- 412 Arlington Falls Ct
- 407 Arlington Falls Ct
- 106 Mulligan Ct
- 217 Wilsons Creek Bend None
- 217 Wilsons Creek Bend
- 107 Wexford Cir
- 101 Wexford Cir
- 507 Wexford Cir
- 104 Bunkers Trail
- 119 Edgarton Way
- 115 Edgarton Way
- 121 Edgarton Way
- 113 Edgarton Way
- 110 Edgarton Way
- 410 Ga Highway 247 S
- 123 Edgarton Way
- 111 Edgarton Way
- 108 Edgarton Way
- 112 Edgarton Way
- 125 Edgarton Way
- 109 Edgarton Way
- 114 Edgarton Way
- 106 Edgarton Way
- 127 Edgarton Way
- 107 Edgarton Way
- 107 Stockton Pass
- 116 Edgarton Way
- 105 Stockton Pass
- 104 Edgarton Way