117 Elliot Ave Quincy, MA 02171
Montclair NeighborhoodEstimated Value: $557,000 - $613,000
About This Home
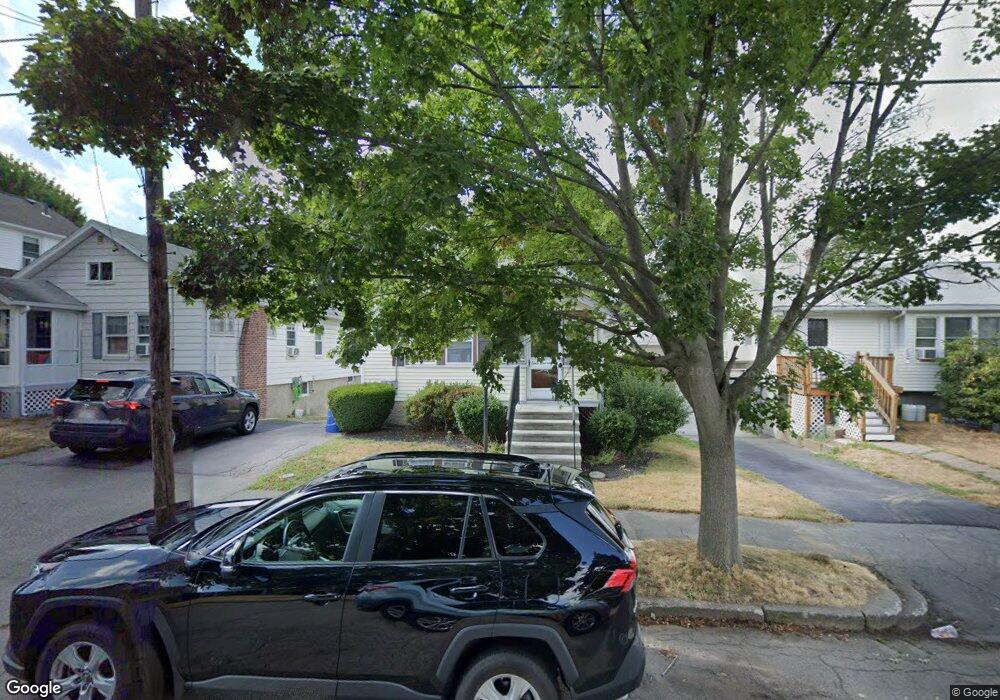
This home is located at 117 Elliot Ave, Quincy, MA 02171 and is currently estimated at $584,231, approximately $730 per square foot. 117 Elliot Ave is a home located in Norfolk County with nearby schools including Montclair Elementary School, Atlantic Middle School, and North Quincy High School.
Ownership History
We collect this data history from publicly available records. To have your information removed, we recommend requesting removal directly through your county’s website.
Purchase Details
Home Values in the Area
Average Home Value in this Area
Purchase History
We collect this data history from publicly available records. To have your information removed, we recommend requesting removal directly through your county’s website.
| Date | Buyer | Sale Price | Title Company |
|---|---|---|---|
| $282,000 | -- |
Mortgage History
We collect this data history from publicly available records. To have your information removed, we recommend requesting removal directly through your county’s website.
| Date | Status | Borrower | Loan Amount |
|---|---|---|---|
| Open | $210,000 |
Tax History
We collect this data history from publicly available records. To have your information removed, we recommend requesting removal directly through your county’s website.
| Year | Tax Paid | Tax Assessment Tax Assessment Total Assessment is a certain percentage of the fair market value that is determined by local assessors to be the total taxable value of land and additions on the property. | Land | Improvement |
|---|---|---|---|---|
| 2025 | $5,782 | $501,500 | $325,100 | $176,400 |
| 2024 | $5,585 | $495,600 | $325,100 | $170,500 |
| 2023 | $5,362 | $481,800 | $309,600 | $172,200 |
| 2022 | $5,132 | $428,400 | $269,200 | $159,200 |
| 2021 | $4,932 | $406,300 | $256,400 | $149,900 |
| 2020 | $4,771 | $383,800 | $256,400 | $127,400 |
| 2019 | $4,505 | $359,000 | $239,700 | $119,300 |
| 2018 | $4,434 | $332,400 | $221,900 | $110,500 |
| 2017 | $4,377 | $308,900 | $211,300 | $97,600 |
| 2016 | $3,988 | $277,700 | $183,800 | $93,900 |
| 2015 | $3,673 | $251,600 | $167,100 | $84,500 |
| 2014 | $3,483 | $234,400 | $159,100 | $75,300 |
Map
- 185 Hamilton Ave
- 89 Ardell St
- 135 Safford St
- 115 W Squantum St Unit 803
- 60 Harriet Ave
- 246 N Central Ave
- 267-269 Farrington St
- 73 Washington St
- 120 Holmes St Unit 304
- 245 Newport Ave
- 251 Newport Ave
- 17 Duggan Ln
- 33 Bishop Rd Unit 33
- 157 Beale St Unit 6
- 157 Beale St Unit 1
- 24 Victory Ave
- 260 Newbury Ave
- 635 Adams St
- 30 Hillside Ave
- 210 Newbury Ave Unit 2L
- 121 Elliot Ave
- 39 Bowdoin St
- 35 Bowdoin St
- 125 Elliot Ave
- 31 Bowdoin St
- 212 Holbrook Rd
- 127 Elliot Ave
- 208 Holbrook Rd
- 216 Holbrook Rd
- 114 Elliot Ave
- 204 Holbrook Rd
- 40 Bowdoin St
- 120 Elliot Ave
- 220 Holbrook Rd
- 131 Elliot Ave
- 126 Elliot Ave
- 106 Elliot Ave
- 53 Bowdoin St
- 196 Holbrook Rd
- 196 Holbrook Rd Unit 2
Ask me questions while you tour the home.