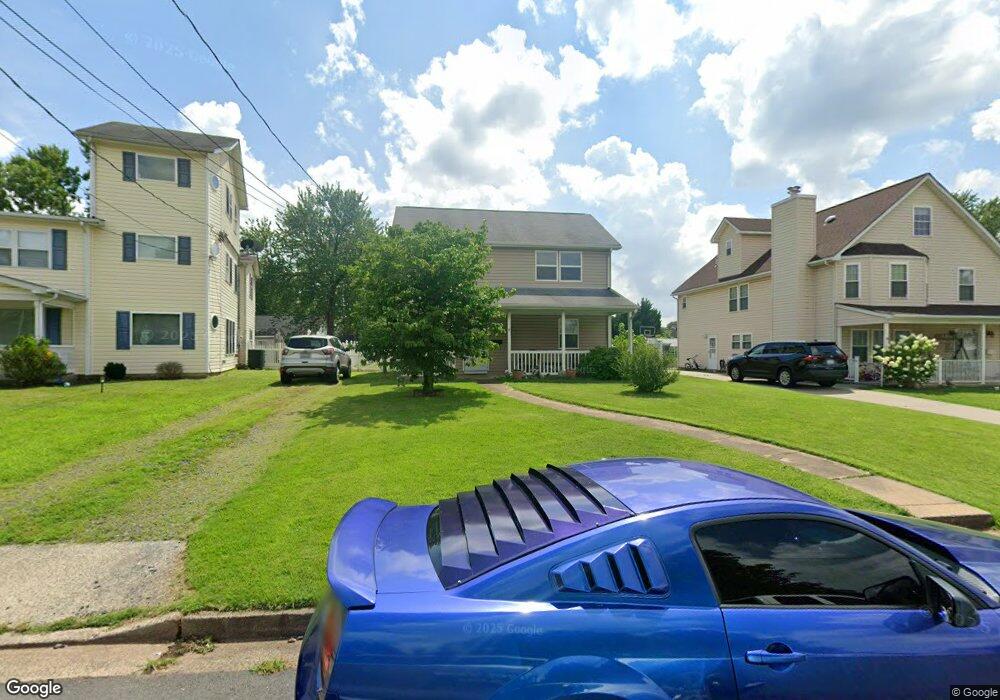
117 Evans St Manassas Park, VA 20111
Estimated Value: $435,000 - $454,000
5
Beds
2
Baths
1,344
Sq Ft
$328/Sq Ft
Est. Value
About This Home
This home is located at 117 Evans St, Manassas Park, VA 20111 and is currently estimated at $440,763, approximately $327 per square foot. 117 Evans St is a home located in Manassas Park City with nearby schools including Cougar Elementary School, Manassas Park Elementary School, and Manassas Park Middle School.
Ownership History
Date
Name
Owned For
Owner Type
Purchase Details
Closed on
Apr 20, 2020
Sold by
Kelpy Rose Ann
Bought by
Kelpy Rose Ann and Rose Ann Kelpy Trust
Current Estimated Value
Purchase Details
Closed on
May 30, 2003
Sold by
Murray Sherrill L
Bought by
Kelpy Larner W
Home Financials for this Owner
Home Financials are based on the most recent Mortgage that was taken out on this home.
Original Mortgage
$112,000
Outstanding Balance
$49,346
Interest Rate
5.86%
Mortgage Type
New Conventional
Estimated Equity
$391,417
Create a Home Valuation Report for This Property
The Home Valuation Report is an in-depth analysis detailing your home's value as well as a comparison with similar homes in the area
Home Values in the Area
Average Home Value in this Area
Purchase History
| Date | Buyer | Sale Price | Title Company |
|---|---|---|---|
| Kelpy Rose Ann | -- | None Available | |
| Kelpy Larner W | $140,000 | -- |
Source: Public Records
Mortgage History
| Date | Status | Borrower | Loan Amount |
|---|---|---|---|
| Open | Kelpy Larner W | $112,000 |
Source: Public Records
Tax History Compared to Growth
Tax History
| Year | Tax Paid | Tax Assessment Tax Assessment Total Assessment is a certain percentage of the fair market value that is determined by local assessors to be the total taxable value of land and additions on the property. | Land | Improvement |
|---|---|---|---|---|
| 2025 | $5,194 | $450,400 | $157,700 | $292,700 |
| 2024 | $5,194 | $393,300 | $143,400 | $249,900 |
| 2023 | $5,194 | $357,500 | $114,700 | $242,800 |
| 2022 | $6,648 | $347,100 | $109,200 | $237,900 |
| 2021 | $6,298 | $424,700 | $94,900 | $329,800 |
| 2020 | $5,922 | $396,900 | $78,300 | $318,600 |
| 2019 | $5,922 | $372,600 | $79,000 | $293,600 |
| 2018 | $5,201 | $351,500 | $74,500 | $277,000 |
| 2017 | $5,096 | $334,700 | $74,500 | $260,200 |
| 2016 | $5,061 | $326,500 | $74,500 | $252,000 |
| 2015 | $3,578 | $305,100 | $74,500 | $230,600 |
| 2014 | $3,578 | $253,300 | $74,500 | $178,800 |
Source: Public Records
Map
Nearby Homes
- 132 Evans St
- 167 Scott Dr
- 8275 Vermont Place
- 185 Cabbel Dr
- 8321 Maplewood Dr
- 8300 Sunnyside Ct
- 8319 Leighlex Ct
- 135 Polk Dr
- 8494 Kirby St
- 8020 Towering Oak Way
- 9022 New Britain Cir
- 8639 Union Place
- 504 Tassita Ln
- 9058 Old Hickory Ct
- 8006 Well St
- 8605 Burnside Ct
- 248 Manassas Dr
- 8239 Glade Bank Dr
- 230 Cabbel Dr
- 259 Moseby Dr