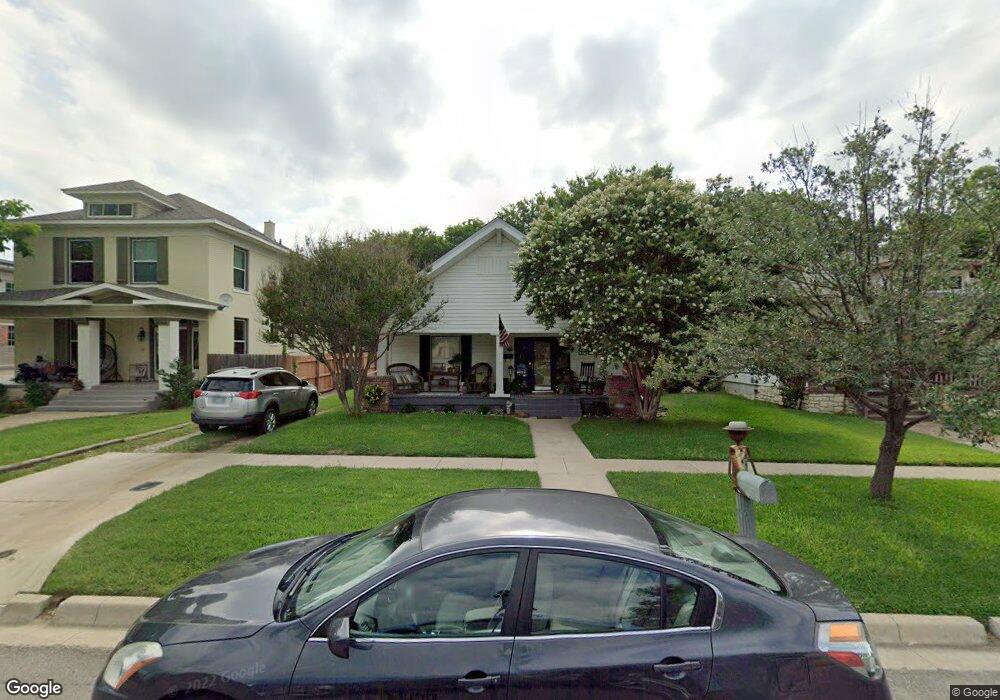
117 F St SW Ardmore, OK 73401
Estimated Value: $147,335 - $175,000
4
Beds
2
Baths
1,427
Sq Ft
$115/Sq Ft
Est. Value
About This Home
This home is located at 117 F St SW, Ardmore, OK 73401 and is currently estimated at $163,584, approximately $114 per square foot. 117 F St SW is a home located in Carter County with nearby schools including Lincoln Elementary School, Ardmore Middle School, and Ardmore High School.
Ownership History
Date
Name
Owned For
Owner Type
Purchase Details
Closed on
Nov 17, 2006
Sold by
Wilkes Nancy Kahlayah and Wilkes James T
Bought by
Buck Charline Diane
Current Estimated Value
Purchase Details
Closed on
Nov 7, 2006
Sold by
Jackson Don N and Jackson Elva
Bought by
Buck Diane
Purchase Details
Closed on
Jun 3, 2005
Sold by
Baxter Scotty L and Baxter Amanda D
Bought by
Wilkes Nancy Kahlay and Wilkes James T
Home Financials for this Owner
Home Financials are based on the most recent Mortgage that was taken out on this home.
Original Mortgage
$50,800
Interest Rate
5.83%
Mortgage Type
New Conventional
Purchase Details
Closed on
Oct 29, 1999
Sold by
Rios Joe M and Rios Candy I
Bought by
Federal National Mortgage
Purchase Details
Closed on
May 20, 1996
Sold by
Mccarthick Alvin L
Bought by
Rios Joe M and Rios Candy I
Create a Home Valuation Report for This Property
The Home Valuation Report is an in-depth analysis detailing your home's value as well as a comparison with similar homes in the area
Home Values in the Area
Average Home Value in this Area
Purchase History
| Date | Buyer | Sale Price | Title Company |
|---|---|---|---|
| Buck Charline Diane | $68,000 | -- | |
| Buck Diane | -- | -- | |
| Wilkes Nancy Kahlay | $63,500 | -- | |
| Federal National Mortgage | -- | -- | |
| Rios Joe M | $51,500 | -- |
Source: Public Records
Mortgage History
| Date | Status | Borrower | Loan Amount |
|---|---|---|---|
| Previous Owner | Wilkes Nancy Kahlay | $50,800 |
Source: Public Records
Tax History Compared to Growth
Tax History
| Year | Tax Paid | Tax Assessment Tax Assessment Total Assessment is a certain percentage of the fair market value that is determined by local assessors to be the total taxable value of land and additions on the property. | Land | Improvement |
|---|---|---|---|---|
| 2024 | $1,154 | $12,193 | $1,800 | $10,393 |
| 2023 | $1,117 | $11,838 | $1,800 | $10,038 |
| 2022 | $1,003 | $11,493 | $1,800 | $9,693 |
| 2021 | $1,025 | $11,158 | $1,800 | $9,358 |
| 2020 | $978 | $10,833 | $2,225 | $8,608 |
| 2019 | $924 | $10,517 | $2,160 | $8,357 |
| 2018 | $909 | $10,211 | $2,096 | $8,115 |
| 2017 | $815 | $9,914 | $2,034 | $7,880 |
| 2016 | $804 | $9,626 | $873 | $8,753 |
| 2015 | $641 | $9,345 | $450 | $8,895 |
| 2014 | $722 | $9,073 | $450 | $8,623 |
Source: Public Records
Map
Nearby Homes