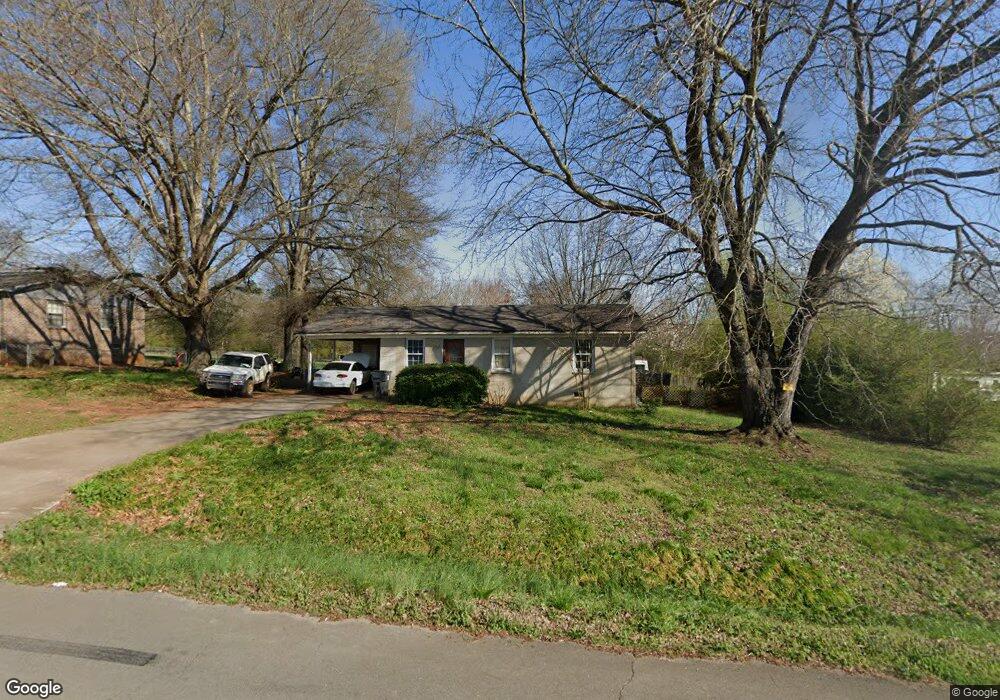
117 Fincher St Cave Spring, GA 30124
Estimated Value: $104,000 - $176,000
--
Bed
--
Bath
1,053
Sq Ft
$121/Sq Ft
Est. Value
About This Home
This home is located at 117 Fincher St, Cave Spring, GA 30124 and is currently estimated at $127,772, approximately $121 per square foot. 117 Fincher St is a home located in Floyd County with nearby schools including Coosa Middle School and Coosa High School.
Ownership History
Date
Name
Owned For
Owner Type
Purchase Details
Closed on
Dec 9, 2019
Sold by
Looney Jerry
Bought by
Burton Gola
Current Estimated Value
Purchase Details
Closed on
Oct 6, 2009
Sold by
Usda Rural Development
Bought by
Looney Jerry
Purchase Details
Closed on
Jul 13, 1998
Sold by
Schuman Howard C
Bought by
Shaker Barbara J
Purchase Details
Closed on
Oct 29, 1997
Sold by
Shaker Barbara J
Bought by
Schuman Howard C
Purchase Details
Closed on
Sep 18, 1995
Sold by
Swinford Travis D
Bought by
Shaker Barbara J
Purchase Details
Closed on
Jun 1, 1992
Sold by
Farmers Home Administration
Bought by
Swinford Travis D
Purchase Details
Closed on
Jul 2, 1991
Sold by
Autry Julus F and Autry Edna Y
Bought by
Farmers Home Administration
Purchase Details
Closed on
Nov 4, 1981
Bought by
Autry Julus F and Autry Edna Y
Create a Home Valuation Report for This Property
The Home Valuation Report is an in-depth analysis detailing your home's value as well as a comparison with similar homes in the area
Home Values in the Area
Average Home Value in this Area
Purchase History
| Date | Buyer | Sale Price | Title Company |
|---|---|---|---|
| Burton Gola | $55,000 | -- | |
| Looney Jerry | -- | -- | |
| Shaker Barbara J | -- | -- | |
| Schuman Howard C | -- | -- | |
| Shaker Barbara J | $39,900 | -- | |
| Swinford Travis D | $36,000 | -- | |
| Farmers Home Administration | $38,000 | -- | |
| Autry Julus F | $34,500 | -- |
Source: Public Records
Tax History Compared to Growth
Tax History
| Year | Tax Paid | Tax Assessment Tax Assessment Total Assessment is a certain percentage of the fair market value that is determined by local assessors to be the total taxable value of land and additions on the property. | Land | Improvement |
|---|---|---|---|---|
| 2024 | $892 | $31,540 | $5,082 | $26,458 |
| 2023 | $830 | $30,348 | $4,620 | $25,728 |
| 2022 | $687 | $25,101 | $3,696 | $21,405 |
| 2021 | $642 | $23,014 | $3,696 | $19,318 |
| 2020 | $595 | $21,164 | $2,772 | $18,392 |
| 2019 | $561 | $20,221 | $2,772 | $17,449 |
| 2018 | $534 | $19,216 | $2,772 | $16,444 |
| 2017 | $521 | $18,700 | $2,772 | $15,928 |
| 2016 | $543 | $19,273 | $2,760 | $16,513 |
| 2015 | $530 | $19,273 | $2,760 | $16,513 |
| 2014 | $530 | $19,273 | $2,760 | $16,513 |
Source: Public Records
Map
Nearby Homes
- 104 Fincher St
- 57 Mill St
- 22 River St SW
- 0 Mill Rd Unit 10629874
- 0 Mill Rd Unit 7670319
- 8876 Cave Spring Rd SW
- 5677 Fosters Mill Rd SW
- 5598 Fosters Mill Rd
- 7 Herschel Mize Dr SW
- 7 Herschel Mize Dr
- 8876 Cave Spring
- 10 Ridge Rd SW
- 0 Melson Rd SW Unit 7676052
- 0 Melson Rd SW Unit 10636997
- 907 Gadsden Rd SW
- 0 McGee Bend Rd SW Unit 10351960
- 424 Michael Blvd
- 383 Valley Grove Rd
- 100 Lee Ave
- 0 Booger Hollow Rd
- 115 Fincher St
- 119 Fincher St
- 0 Fincher St Unit 9057188
- 113 Fincher St
- 10 11 Glenda
- 2 Georgia Ave
- 2 Georgia Ave Unit 2
- 2 Georgia Ave Unit 10
- 2 Georgia Ave Unit 8
- 2 Georgia Ave Unit 6
- 2 Georgia Ave Unit 4
- 2 Georgia Ave
- 2 Fincher St
- 111 Fincher St
- 112 Fincher St
- 110 Fincher St
- 109 Fincher St
- 108 Fincher St
- 107 Fincher St
- 106 Fincher St