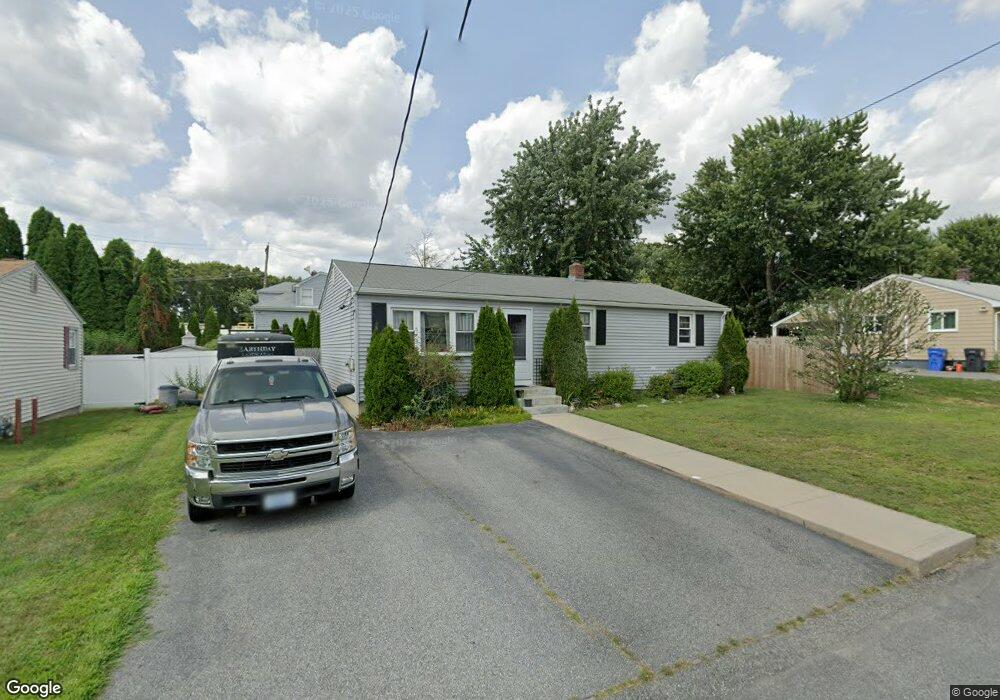
117 Gordon St Cranston, RI 02910
Spectacle NeighborhoodEstimated Value: $362,000 - $365,595
3
Beds
1
Bath
1,008
Sq Ft
$361/Sq Ft
Est. Value
About This Home
This home is located at 117 Gordon St, Cranston, RI 02910 and is currently estimated at $363,649, approximately $360 per square foot. 117 Gordon St is a home located in Providence County with nearby schools including Stadium Elementary School, Hugh B. Bain Middle School, and Cranston High School East.
Ownership History
Date
Name
Owned For
Owner Type
Purchase Details
Closed on
May 11, 2011
Sold by
Mcginn Alice M
Bought by
Mcginn Robert E and Mcginn Gail A
Current Estimated Value
Purchase Details
Closed on
Aug 22, 1991
Sold by
Perry Donald K
Bought by
Mcginn Robert E
Create a Home Valuation Report for This Property
The Home Valuation Report is an in-depth analysis detailing your home's value as well as a comparison with similar homes in the area
Home Values in the Area
Average Home Value in this Area
Purchase History
| Date | Buyer | Sale Price | Title Company |
|---|---|---|---|
| Mcginn Robert E | -- | -- | |
| Mcginn Alice M | $137,700 | -- | |
| Mcginn Robert E | $95,000 | -- |
Source: Public Records
Mortgage History
| Date | Status | Borrower | Loan Amount |
|---|---|---|---|
| Open | Mcginn Robert E | $99,000 | |
| Previous Owner | Mcginn Robert E | $125,000 | |
| Previous Owner | Mcginn Robert E | $103,500 |
Source: Public Records
Tax History
| Year | Tax Paid | Tax Assessment Tax Assessment Total Assessment is a certain percentage of the fair market value that is determined by local assessors to be the total taxable value of land and additions on the property. | Land | Improvement |
|---|---|---|---|---|
| 2025 | $3,952 | $284,700 | $96,600 | $188,100 |
| 2024 | $3,875 | $284,700 | $96,600 | $188,100 |
| 2023 | $3,716 | $196,600 | $66,600 | $130,000 |
| 2022 | $3,639 | $196,600 | $66,600 | $130,000 |
| 2021 | $3,539 | $196,600 | $66,600 | $130,000 |
| 2020 | $3,354 | $161,500 | $63,300 | $98,200 |
| 2019 | $3,354 | $161,500 | $63,300 | $98,200 |
| 2018 | $3,277 | $161,500 | $63,300 | $98,200 |
| 2017 | $2,973 | $129,600 | $46,600 | $83,000 |
| 2016 | $2,910 | $129,600 | $46,600 | $83,000 |
| 2015 | $2,910 | $129,600 | $46,600 | $83,000 |
| 2014 | $2,978 | $130,400 | $46,600 | $83,800 |
Source: Public Records
Map
Nearby Homes
Your Personal Tour Guide
Ask me questions while you tour the home.