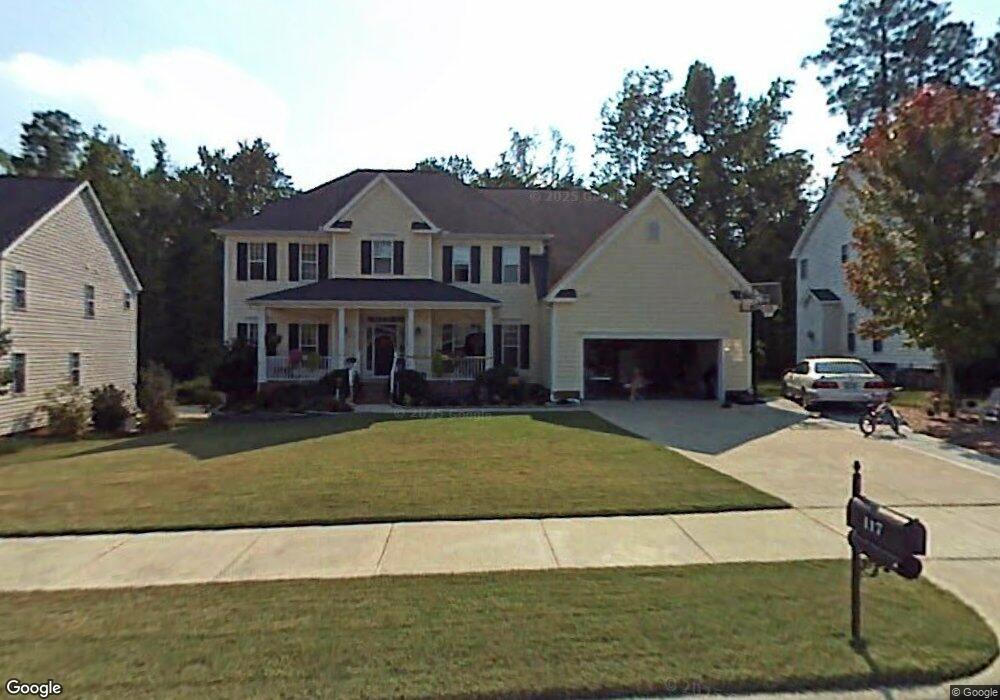
117 Hasbrouck Dr Apex, NC 27523
West Cary NeighborhoodEstimated Value: $785,000 - $856,663
4
Beds
4
Baths
3,674
Sq Ft
$220/Sq Ft
Est. Value
About This Home
This home is located at 117 Hasbrouck Dr, Apex, NC 27523 and is currently estimated at $807,666, approximately $219 per square foot. 117 Hasbrouck Dr is a home located in Wake County with nearby schools including Salem Elementary, Salem Middle, and Green Hope High.
Ownership History
Date
Name
Owned For
Owner Type
Purchase Details
Closed on
May 2, 2024
Sold by
Kelliher James
Bought by
Chartier Patricia L
Current Estimated Value
Purchase Details
Closed on
Jan 12, 2017
Sold by
Chartiner Greg L
Bought by
Chartier Patricia L
Purchase Details
Closed on
Feb 16, 2001
Sold by
New Fortis Corporation The
Bought by
Chartier Greg L and Chartier Patricia L
Create a Home Valuation Report for This Property
The Home Valuation Report is an in-depth analysis detailing your home's value as well as a comparison with similar homes in the area
Home Values in the Area
Average Home Value in this Area
Purchase History
| Date | Buyer | Sale Price | Title Company |
|---|---|---|---|
| Chartier Patricia L | -- | None Listed On Document | |
| Chartier Patricia L | -- | None Available | |
| Chartier Greg L | $300,000 | -- |
Source: Public Records
Tax History
| Year | Tax Paid | Tax Assessment Tax Assessment Total Assessment is a certain percentage of the fair market value that is determined by local assessors to be the total taxable value of land and additions on the property. | Land | Improvement |
|---|---|---|---|---|
| 2025 | $6,758 | $771,689 | $215,000 | $556,689 |
| 2024 | $6,606 | $771,689 | $215,000 | $556,689 |
Source: Public Records
Map
Nearby Homes
- 100 Wentbridge Rd
- 112 Del Rio Dr
- 105 Catchpenny Ct
- 217 Old Dock Trail
- 116 Love Valley Dr
- 306 Burgwin Wright Way
- 308 Burgwin Wright Way
- 416 Hopwood Way
- 2004 Sassacus Ln
- 114 Calebra Way
- 103 Jordan Creek Dr
- 538 Rowanwood Way
- 146 Swan Quarter Dr
- 120 Seymour Creek Dr
- 1636 Wilde Bend
- 552 Rowanwood Way
- 1808 Beaudet Ln
- 412 Brierley Dr
- 614 Gravel Brook Ct
- 302 Halls Mill Dr
- 119 Hasbrouck Dr
- 115 Hasbrouck Dr
- 113 Hasbrouck Dr
- 121 Hasbrouck Dr
- 201 Jennyanne Ct
- 201 Jerryanne Ct
- 110 Hasbrouck Dr
- 201 Hasbrouck Dr
- 111 Hasbrouck Dr
- 203 Jennyanne Ct
- 203 Jerryanne Ct
- 200 Jennyanne Ct
- 200 Jerryanne Ct
- 1217 Twin Creek Rd
- 108 Hasbrouck Dr
- 203 Hasbrouck Dr
- 205 Jennyanne Ct
- 205 Jerryanne Ct
- 202 Jennyanne Ct
- 202 Jerryanne Ct
Your Personal Tour Guide
Ask me questions while you tour the home.