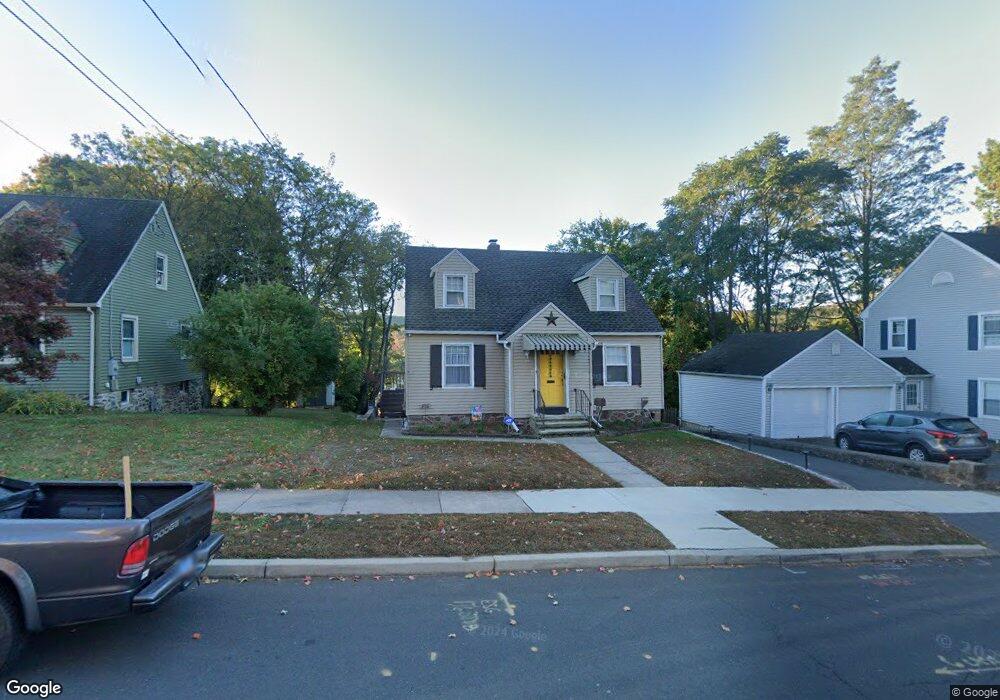
117 Haviland St Bristol, CT 06010
Downtown Bristol NeighborhoodEstimated Value: $254,000 - $269,031
2
Beds
2
Baths
1,093
Sq Ft
$241/Sq Ft
Est. Value
About This Home
This home is located at 117 Haviland St, Bristol, CT 06010 and is currently estimated at $263,008, approximately $240 per square foot. 117 Haviland St is a home located in Hartford County with nearby schools including West Bristol Sch, Bristol Central High School, and Immanuel Lutheran School.
Ownership History
Date
Name
Owned For
Owner Type
Purchase Details
Closed on
Sep 1, 1998
Sold by
Micari James P
Bought by
Liyotte Marc and Liyotte Doris
Current Estimated Value
Home Financials for this Owner
Home Financials are based on the most recent Mortgage that was taken out on this home.
Original Mortgage
$94,200
Outstanding Balance
$20,122
Interest Rate
6.9%
Mortgage Type
Unknown
Estimated Equity
$242,886
Create a Home Valuation Report for This Property
The Home Valuation Report is an in-depth analysis detailing your home's value as well as a comparison with similar homes in the area
Home Values in the Area
Average Home Value in this Area
Purchase History
| Date | Buyer | Sale Price | Title Company |
|---|---|---|---|
| Liyotte Marc | $94,000 | -- |
Source: Public Records
Mortgage History
| Date | Status | Borrower | Loan Amount |
|---|---|---|---|
| Open | Liyotte Marc | $94,200 | |
| Closed | Liyotte Marc | $6,000 |
Source: Public Records
Tax History Compared to Growth
Tax History
| Year | Tax Paid | Tax Assessment Tax Assessment Total Assessment is a certain percentage of the fair market value that is determined by local assessors to be the total taxable value of land and additions on the property. | Land | Improvement |
|---|---|---|---|---|
| 2025 | $4,007 | $118,720 | $31,920 | $86,800 |
| 2024 | $3,763 | $118,160 | $31,920 | $86,240 |
| 2023 | $3,586 | $118,160 | $31,920 | $86,240 |
| 2022 | $3,315 | $86,450 | $24,220 | $62,230 |
| 2021 | $3,315 | $86,450 | $24,220 | $62,230 |
| 2020 | $3,315 | $86,450 | $24,220 | $62,230 |
| 2019 | $3,289 | $86,450 | $24,220 | $62,230 |
| 2018 | $3,188 | $86,450 | $24,220 | $62,230 |
| 2017 | $3,105 | $86,170 | $34,580 | $51,590 |
| 2016 | $3,105 | $86,170 | $34,580 | $51,590 |
| 2015 | $2,982 | $86,170 | $34,580 | $51,590 |
| 2014 | $2,982 | $86,170 | $34,580 | $51,590 |
Source: Public Records
Map
Nearby Homes