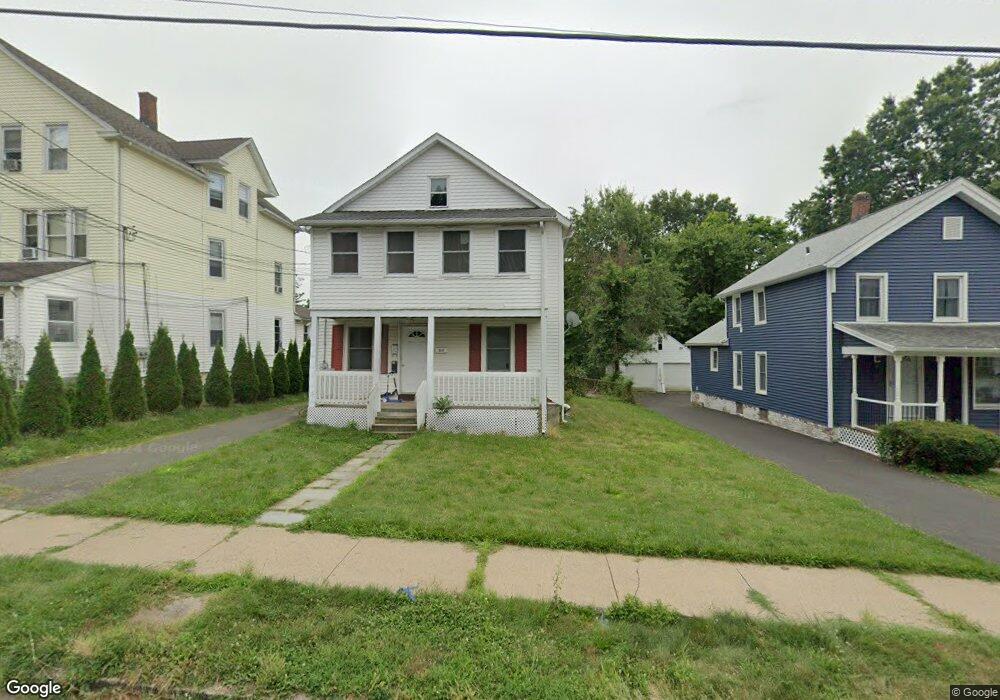
117 Henry St New Britain, CT 06051
Estimated Value: $296,843 - $459,000
4
Beds
2
Baths
1,800
Sq Ft
$209/Sq Ft
Est. Value
About This Home
This home is located at 117 Henry St, New Britain, CT 06051 and is currently estimated at $375,461, approximately $208 per square foot. 117 Henry St is a home located in Hartford County with nearby schools including Slade Middle School and Mountain Laurel Sudbury School.
Ownership History
Date
Name
Owned For
Owner Type
Purchase Details
Closed on
Oct 18, 2010
Sold by
185 W Main Street Llc
Bought by
Carrillo Maria A
Current Estimated Value
Home Financials for this Owner
Home Financials are based on the most recent Mortgage that was taken out on this home.
Original Mortgage
$182,442
Outstanding Balance
$122,819
Interest Rate
4.75%
Mortgage Type
FHA
Estimated Equity
$252,642
Purchase Details
Closed on
Apr 30, 2010
Sold by
Mangiafieo Emanule A
Bought by
185 W Main Street Llc
Purchase Details
Closed on
Apr 19, 2010
Sold by
Citifinancial Inc
Bought by
Mangiafico Emanuele A
Purchase Details
Closed on
Mar 15, 2010
Sold by
Ogando Lenny
Bought by
Citifinancial Inc
Purchase Details
Closed on
Apr 18, 2005
Sold by
Est Snow Arlene W and Gufert John H
Bought by
Ogando Lenny
Create a Home Valuation Report for This Property
The Home Valuation Report is an in-depth analysis detailing your home's value as well as a comparison with similar homes in the area
Home Values in the Area
Average Home Value in this Area
Purchase History
| Date | Buyer | Sale Price | Title Company |
|---|---|---|---|
| Carrillo Maria A | $184,900 | -- | |
| 185 W Main Street Llc | -- | -- | |
| Mangiafico Emanuele A | $60,000 | -- | |
| Citifinancial Inc | -- | -- | |
| Ogando Lenny | $158,200 | -- |
Source: Public Records
Mortgage History
| Date | Status | Borrower | Loan Amount |
|---|---|---|---|
| Open | Ogando Lenny | $182,442 | |
| Previous Owner | Ogando Lenny | $15,736 | |
| Previous Owner | Ogando Lenny | $191,506 |
Source: Public Records
Tax History Compared to Growth
Tax History
| Year | Tax Paid | Tax Assessment Tax Assessment Total Assessment is a certain percentage of the fair market value that is determined by local assessors to be the total taxable value of land and additions on the property. | Land | Improvement |
|---|---|---|---|---|
| 2025 | $6,398 | $163,310 | $53,200 | $110,110 |
| 2024 | $6,465 | $163,310 | $53,200 | $110,110 |
| 2023 | $6,252 | $163,310 | $53,200 | $110,110 |
| 2022 | $5,139 | $103,810 | $24,500 | $79,310 |
| 2021 | $5,139 | $103,810 | $24,500 | $79,310 |
| 2020 | $5,242 | $103,810 | $24,500 | $79,310 |
| 2019 | $5,242 | $103,810 | $24,500 | $79,310 |
| 2018 | $5,242 | $103,810 | $24,500 | $79,310 |
| 2017 | $5,133 | $101,640 | $24,500 | $77,140 |
| 2016 | $5,133 | $101,640 | $24,500 | $77,140 |
| 2015 | $4,980 | $101,640 | $24,500 | $77,140 |
| 2014 | $4,980 | $101,640 | $24,500 | $77,140 |
Source: Public Records
Map
Nearby Homes