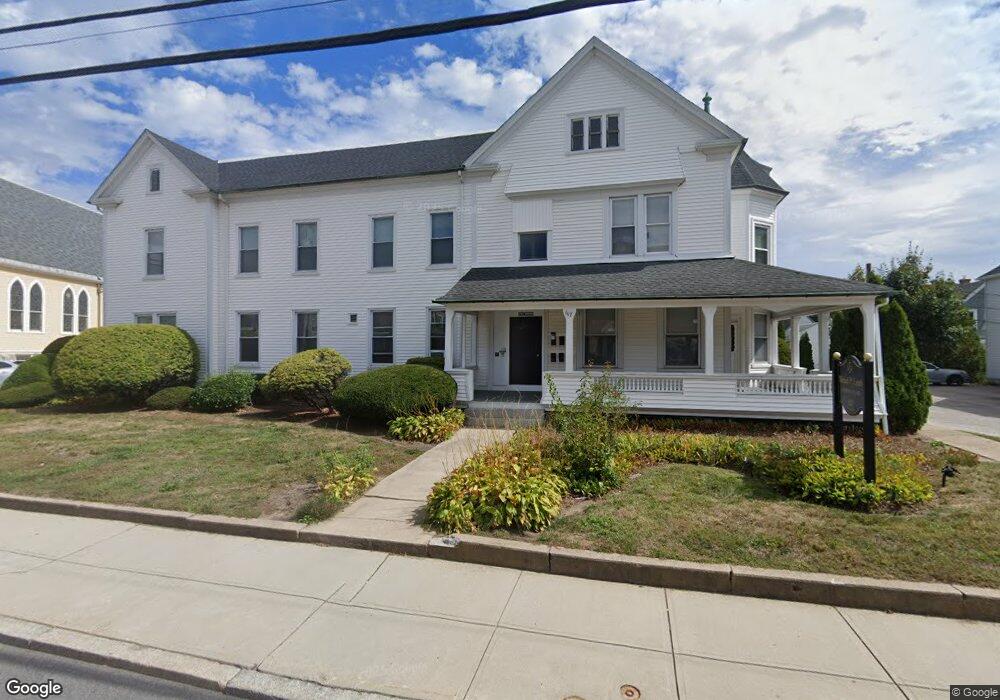
117 High St Westerly, RI 02891
Estimated Value: $1,256,073
Studio
--
Bath
4,854
Sq Ft
$259/Sq Ft
Est. Value
About This Home
This home is located at 117 High St, Westerly, RI 02891 and is currently estimated at $1,256,073, approximately $258 per square foot. 117 High St is a home located in Washington County with nearby schools including Westerly High School and St. Michael School.
Ownership History
Date
Name
Owned For
Owner Type
Purchase Details
Closed on
Dec 30, 2021
Sold by
Lynch Michael P
Bought by
Lynch Michael P and Lynch Gina M
Current Estimated Value
Purchase Details
Closed on
Jul 3, 2013
Sold by
Ptl Props Llc
Bought by
Enpavtail Llc
Purchase Details
Closed on
Oct 1, 1997
Sold by
Westerly Properties
Bought by
Lynch Michael P
Home Financials for this Owner
Home Financials are based on the most recent Mortgage that was taken out on this home.
Original Mortgage
$186,000
Interest Rate
7.41%
Mortgage Type
Commercial
Create a Home Valuation Report for This Property
The Home Valuation Report is an in-depth analysis detailing your home's value as well as a comparison with similar homes in the area
Home Values in the Area
Average Home Value in this Area
Purchase History
| Date | Buyer | Sale Price | Title Company |
|---|---|---|---|
| Lynch Michael P | -- | None Available | |
| Lynch Michael P | -- | None Available | |
| Lynch Michael P | -- | None Available | |
| Enpavtail Llc | -- | -- | |
| Enpavtail Llc | -- | -- | |
| Lynch Michael P | $232,500 | -- | |
| Lynch Michael P | $232,500 | -- |
Source: Public Records
Mortgage History
| Date | Status | Borrower | Loan Amount |
|---|---|---|---|
| Previous Owner | Lynch Michael P | $186,000 |
Source: Public Records
Tax History
| Year | Tax Paid | Tax Assessment Tax Assessment Total Assessment is a certain percentage of the fair market value that is determined by local assessors to be the total taxable value of land and additions on the property. | Land | Improvement |
|---|---|---|---|---|
| 2025 | $4,463 | $573,700 | $181,600 | $392,100 |
| 2024 | $5,539 | $530,000 | $165,400 | $364,600 |
| 2023 | $5,385 | $530,000 | $165,400 | $364,600 |
| 2022 | $5,353 | $530,000 | $165,400 | $364,600 |
| 2021 | $6,300 | $522,400 | $157,500 | $364,900 |
| 2020 | $6,190 | $522,400 | $157,500 | $364,900 |
| 2019 | $6,133 | $522,400 | $157,500 | $364,900 |
| 2018 | $6,243 | $505,500 | $152,900 | $352,600 |
| 2017 | $6,066 | $505,500 | $152,900 | $352,600 |
| 2016 | $6,066 | $505,500 | $152,900 | $352,600 |
| 2015 | $5,860 | $521,800 | $152,900 | $368,900 |
| 2014 | $5,766 | $521,800 | $152,900 | $368,900 |
Source: Public Records
Map
Nearby Homes
- 55 Pleasant St
- 21 Linden St
- 52 Bellevue Ave
- 5 Marion St
- 3 Columbus Ave
- 12 Batterson Ave
- 25 School St Unit 2
- 16 Spring St
- 2 Marichris Dr
- 141 W Broad St
- 13 Moss St
- 15 Moss St
- 22 Colonial Dr
- 0 Iroquois Ave
- 6 Acorn Dr
- 6 Beatrice St
- 19 Apache Dr Unit F
- 19 Apache Dr Unit 19C
- 12 Apache Dr Unit A
- 51 Pequot Trail
Your Personal Tour Guide
Ask me questions while you tour the home.