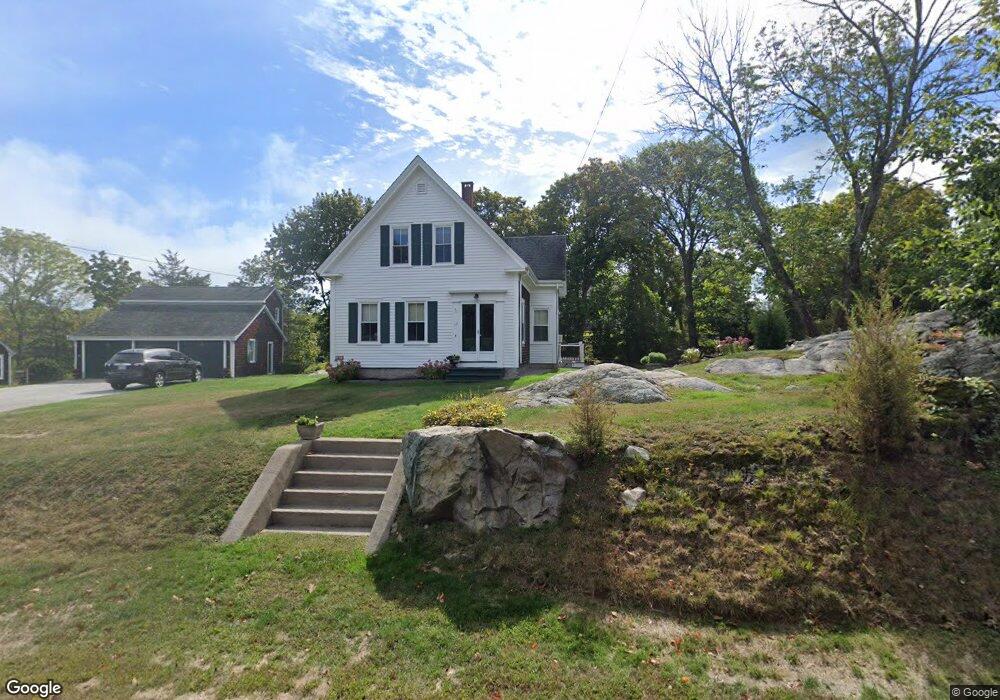
117 Hull St Cohasset, MA 02025
Estimated Value: $576,000 - $866,000
6
Beds
4
Baths
1,936
Sq Ft
$369/Sq Ft
Est. Value
About This Home
This home is located at 117 Hull St, Cohasset, MA 02025 and is currently estimated at $713,468, approximately $368 per square foot. 117 Hull St is a home located in Norfolk County with nearby schools including Joseph Osgood School, Deer Hill School, and Cohasset Middle School.
Ownership History
Date
Name
Owned For
Owner Type
Purchase Details
Closed on
May 7, 1998
Sold by
Studley Ester
Bought by
Studley Ernest A and Studley Sharyn K
Current Estimated Value
Home Financials for this Owner
Home Financials are based on the most recent Mortgage that was taken out on this home.
Original Mortgage
$175,000
Interest Rate
7.05%
Mortgage Type
Purchase Money Mortgage
Create a Home Valuation Report for This Property
The Home Valuation Report is an in-depth analysis detailing your home's value as well as a comparison with similar homes in the area
Home Values in the Area
Average Home Value in this Area
Purchase History
| Date | Buyer | Sale Price | Title Company |
|---|---|---|---|
| Studley Ernest A | $175,000 | -- |
Source: Public Records
Mortgage History
| Date | Status | Borrower | Loan Amount |
|---|---|---|---|
| Open | Studley Ernest A | $150,000 | |
| Closed | Studley Ernest A | $175,000 |
Source: Public Records
Tax History Compared to Growth
Tax History
| Year | Tax Paid | Tax Assessment Tax Assessment Total Assessment is a certain percentage of the fair market value that is determined by local assessors to be the total taxable value of land and additions on the property. | Land | Improvement |
|---|---|---|---|---|
| 2025 | $6,170 | $532,800 | $267,400 | $265,400 |
| 2024 | $6,029 | $495,400 | $223,000 | $272,400 |
| 2023 | $5,845 | $495,300 | $222,900 | $272,400 |
| 2022 | $5,480 | $436,300 | $197,700 | $238,600 |
| 2021 | $5,794 | $444,300 | $197,700 | $246,600 |
| 2020 | $5,763 | $444,300 | $197,700 | $246,600 |
| 2019 | $5,731 | $444,300 | $197,700 | $246,600 |
| 2018 | $5,683 | $444,300 | $197,700 | $246,600 |
| 2017 | $5,776 | $442,300 | $188,300 | $254,000 |
| 2016 | $5,697 | $442,300 | $188,300 | $254,000 |
| 2015 | $5,622 | $442,300 | $188,300 | $254,000 |
| 2014 | $5,388 | $429,700 | $179,800 | $249,900 |
Source: Public Records
Map
Nearby Homes
- 114 Hull St
- 166 Hull St
- 321 Rockland St
- 10 Chestnut Place
- 6 Grace Dr
- 45 Ocean Ledge Dr
- 10 Ocean Ledge Dr
- LOT 1B Rockland St
- 1 Gatehouse Ln Unit 1
- 506 N Main St
- 512 N Main St
- 129 Chief Justice Cushing Hwy
- 23 Wyola Rd
- 101 Rockland St
- 152 Forest Ave
- 121 Nantasket Ave Unit 503
- 22 Berkley Rd Unit B
- 22 Berkley Rd Unit C
- 54 Salisbury St Waterfront
- 6 State Park Rd Unit 2