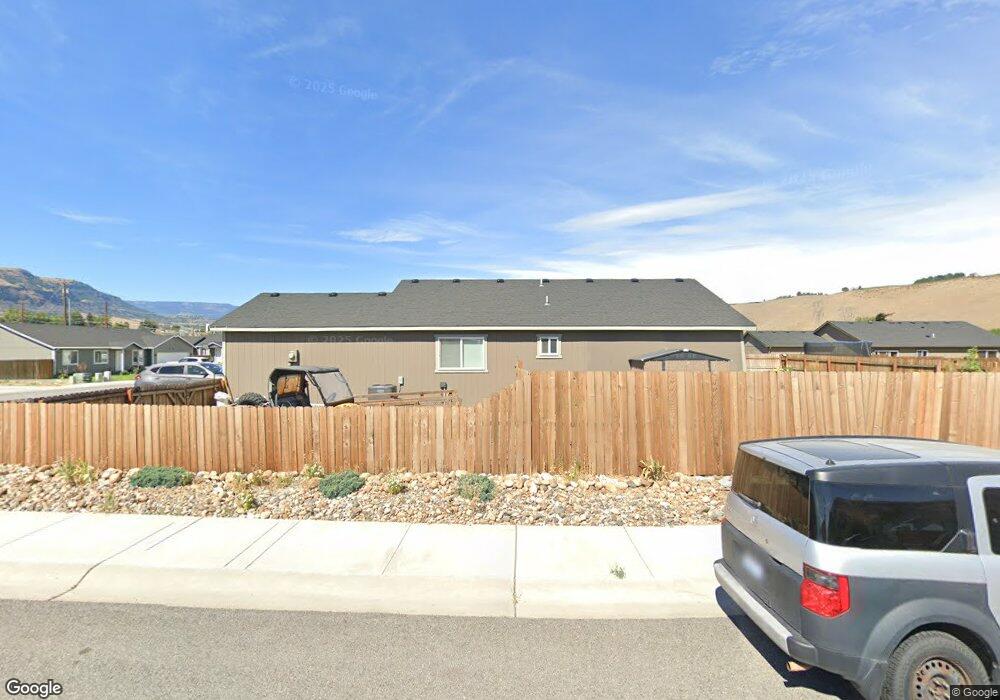
117 Island Loop Rock Island, WA 98850
Estimated Value: $382,000 - $429,000
3
Beds
2
Baths
1,153
Sq Ft
$355/Sq Ft
Est. Value
About This Home
This home is located at 117 Island Loop, Rock Island, WA 98850 and is currently estimated at $409,636, approximately $355 per square foot. 117 Island Loop is a home with nearby schools including Rock Island Elementary School, Clovis Point Intermediate School, and Eastmont Junior High School.
Ownership History
Date
Name
Owned For
Owner Type
Purchase Details
Closed on
Mar 15, 2021
Sold by
Engley Holly
Bought by
Engley Ryan
Current Estimated Value
Home Financials for this Owner
Home Financials are based on the most recent Mortgage that was taken out on this home.
Original Mortgage
$248,800
Outstanding Balance
$223,780
Interest Rate
2.9%
Mortgage Type
New Conventional
Estimated Equity
$185,856
Purchase Details
Closed on
Jan 9, 2017
Sold by
Cameo Vista Corp
Bought by
Engley Ryan and Engley Holly
Home Financials for this Owner
Home Financials are based on the most recent Mortgage that was taken out on this home.
Original Mortgage
$190,671
Interest Rate
4.08%
Mortgage Type
New Conventional
Create a Home Valuation Report for This Property
The Home Valuation Report is an in-depth analysis detailing your home's value as well as a comparison with similar homes in the area
Home Values in the Area
Average Home Value in this Area
Purchase History
| Date | Buyer | Sale Price | Title Company |
|---|---|---|---|
| Engley Ryan | -- | First American Ttl Wenatchee | |
| Engley Ryan | $188,764 | North Meridian Title & Escro |
Source: Public Records
Mortgage History
| Date | Status | Borrower | Loan Amount |
|---|---|---|---|
| Open | Engley Ryan | $248,800 | |
| Closed | Engley Ryan | $190,671 |
Source: Public Records
Tax History Compared to Growth
Tax History
| Year | Tax Paid | Tax Assessment Tax Assessment Total Assessment is a certain percentage of the fair market value that is determined by local assessors to be the total taxable value of land and additions on the property. | Land | Improvement |
|---|---|---|---|---|
| 2025 | $2,232 | $349,300 | $42,000 | $307,300 |
| 2024 | $2,232 | $270,500 | $42,000 | $228,500 |
| 2023 | $2,474 | $254,800 | $42,000 | $212,800 |
| 2022 | $2,592 | $254,800 | $42,000 | $212,800 |
| 2021 | $2,837 | $254,800 | $42,000 | $212,800 |
| 2020 | $1,993 | $254,800 | $42,000 | $212,800 |
| 2018 | $2,053 | $177,100 | $42,000 | $135,100 |
| 2017 | $448 | $177,100 | $42,000 | $135,100 |
| 2016 | $467 | $42,000 | $42,000 | $0 |
| 2015 | -- | $42,000 | $42,000 | $0 |
Source: Public Records
Map
Nearby Homes
- 1611 Douglas St
- 0 NNA Rock Island Dr
- 1511 Center St
- 7 Cambridge Ave
- 1366 Theo Way
- 1344 Theo Way
- 352 Hammond Ln
- 103 George Loop
- 6856 Batterman Rd
- 95 Laurel Estates
- 1114 Wells St
- 5060 Washington 28
- 1550 Pear Ln
- 5097 Malaga Alcoa Hwy
- 44 Sageland
- 583 S Webb Ave
- 559 S Webb Ave
- 539 S Webb Ave
- 0 Yote Rd
- 0 Ward St
- 177 Island Loop Rd
- 177 Island Loop
- 125 Island Loop
- 169 Island Loop Rd
- 118 Island Loop
- 192 Island Loop
- 112 Island Loop
- 124 Island Loop
- 186 Island Loop
- 104 Island Loop
- 135 Island Loop
- 135 Island Loop
- 174 Island Loop
- 130 Island Loop
- 161 Island Loop Rd
- 178 Island Loop
- 168 Island Loop Rd
- 182 Island Loop
- 134 Island Loop
- 109 Hanna Place