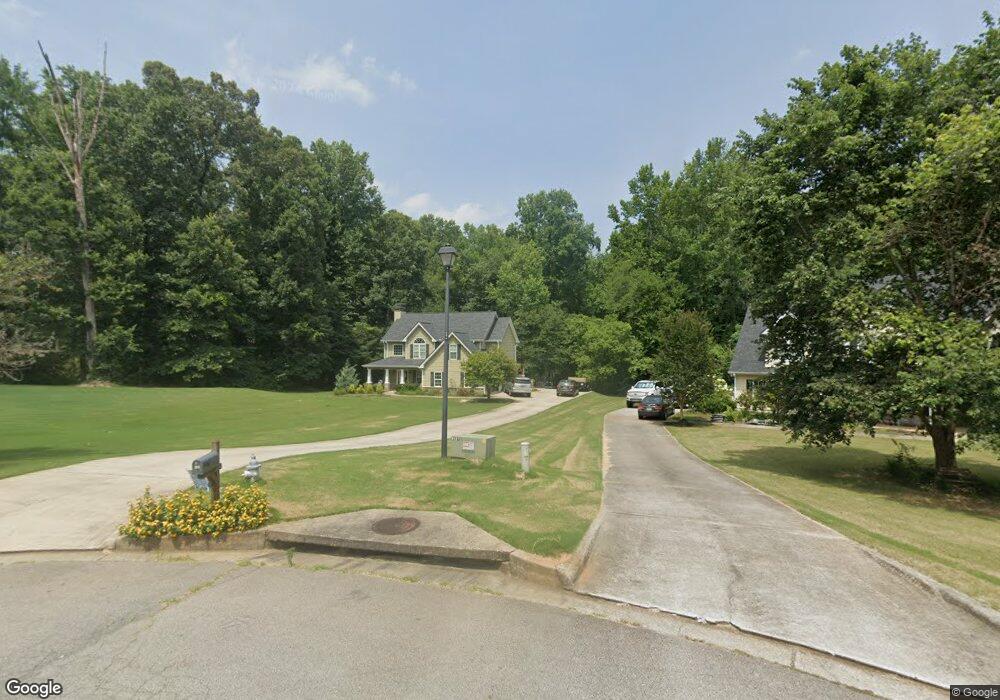
117 Jacksons Walk Unit 6 Jefferson, GA 30549
Estimated Value: $386,000 - $442,000
3
Beds
3
Baths
2,250
Sq Ft
$183/Sq Ft
Est. Value
About This Home
This home is located at 117 Jacksons Walk Unit 6, Jefferson, GA 30549 and is currently estimated at $411,861, approximately $183 per square foot. 117 Jacksons Walk Unit 6 is a home located in Jackson County with nearby schools including Jefferson Elementary School, Jefferson Academy, and Jefferson Middle School.
Ownership History
Date
Name
Owned For
Owner Type
Purchase Details
Closed on
Jul 10, 2017
Sold by
Vaughn Dustin L
Bought by
Vaughn Dustin L and Vaughn Jessica Brooke
Current Estimated Value
Home Financials for this Owner
Home Financials are based on the most recent Mortgage that was taken out on this home.
Original Mortgage
$204,133
Outstanding Balance
$170,414
Interest Rate
4.5%
Mortgage Type
FHA
Estimated Equity
$241,447
Purchase Details
Closed on
Oct 29, 2008
Sold by
Kemp Jack K
Bought by
Wynne Michael D and Wynne Victoria S
Home Financials for this Owner
Home Financials are based on the most recent Mortgage that was taken out on this home.
Original Mortgage
$197,900
Interest Rate
6.11%
Mortgage Type
FHA
Purchase Details
Closed on
Dec 22, 2004
Sold by
Rackley Construction Inc
Bought by
Kemp Jack K
Purchase Details
Closed on
Jun 27, 2003
Sold by
Thompson Russell D
Bought by
Rackley Construction Inc
Purchase Details
Closed on
Apr 9, 2003
Sold by
Cooper Mary A
Bought by
Thompson Russell D
Create a Home Valuation Report for This Property
The Home Valuation Report is an in-depth analysis detailing your home's value as well as a comparison with similar homes in the area
Home Values in the Area
Average Home Value in this Area
Purchase History
| Date | Buyer | Sale Price | Title Company |
|---|---|---|---|
| Vaughn Dustin L | -- | -- | |
| Vaughn Dustin L | $207,900 | -- | |
| Wynne Michael D | $199,000 | -- | |
| Kemp Jack K | $177,200 | -- | |
| Kemp Jack K | $177,200 | -- | |
| Rackley Construction Inc | $112,000 | -- | |
| Thompson Russell D | $83,500 | -- |
Source: Public Records
Mortgage History
| Date | Status | Borrower | Loan Amount |
|---|---|---|---|
| Open | Vaughn Dustin L | $204,133 | |
| Closed | Vaughn Dustin L | $204,133 | |
| Previous Owner | Wynne Michael D | $197,900 |
Source: Public Records
Tax History
| Year | Tax Paid | Tax Assessment Tax Assessment Total Assessment is a certain percentage of the fair market value that is determined by local assessors to be the total taxable value of land and additions on the property. | Land | Improvement |
|---|---|---|---|---|
| 2025 | $3,570 | $127,640 | $20,800 | $106,840 |
| 2024 | $3,570 | $127,640 | $20,800 | $106,840 |
| 2023 | $3,584 | $115,880 | $20,800 | $95,080 |
| 2022 | $3,208 | $97,880 | $20,800 | $77,080 |
| 2021 | $3,068 | $91,880 | $14,800 | $77,080 |
| 2020 | $2,788 | $77,880 | $14,800 | $63,080 |
| 2019 | $2,828 | $77,880 | $14,800 | $63,080 |
| 2018 | $2,759 | $74,760 | $14,800 | $59,960 |
| 2017 | $2,648 | $70,816 | $14,800 | $56,016 |
| 2016 | $2,660 | $70,816 | $14,800 | $56,016 |
| 2015 | $2,219 | $66,016 | $10,000 | $56,016 |
| 2014 | $1,939 | $57,524 | $10,000 | $47,524 |
| 2013 | -- | $57,523 | $10,000 | $47,523 |
Source: Public Records
Map
Nearby Homes
- 66 Wren Ave
- 354 Paxton Ln
- 1600 Jackson Trail Rd
- 461 Paxton Ln
- 131 Wood Cove
- 175 Paxton Ln
- 12 Chatham Ct
- 47 Chatham Ct
- 594 Paxton Ln
- 18 Raven Ridge
- 121 Carver Dr
- 179 Raven Ridge
- 690 Lake Vista Dr
- 1509 Nightingale St
- 250 Bryce Ave
- 1549 Nightingale St
- 420 Andrew Ridge Dr
- 520 Virginia Ave
- 1755 Lark Trail
- 175 Thornberry Ln
- 117 Jacksons Walk
- 114 Jacksons Walk
- 3909 Winder Hwy
- 109 Jacksons Walk
- 100 Jacksons Walk
- 87 Jacksons Walk Unit 4
- 72 Jacksons Walk
- 001 Hwy 11
- 61 Jacksons Walk
- 48 Jacksons Walk
- 33 Jacksons Walk
- 1180 Jackson Trail Rd
- 3920 Winder Hwy
- 2 Jacksons Walk
- 1164 Jackson Trail Rd
- 26 Jacksons Walk Unit 11
- 26 Jacksons Walk
- 15 Jacksons Walk
- 4002 Winder Hwy
- 1295 Jackson Trail Rd
Your Personal Tour Guide
Ask me questions while you tour the home.