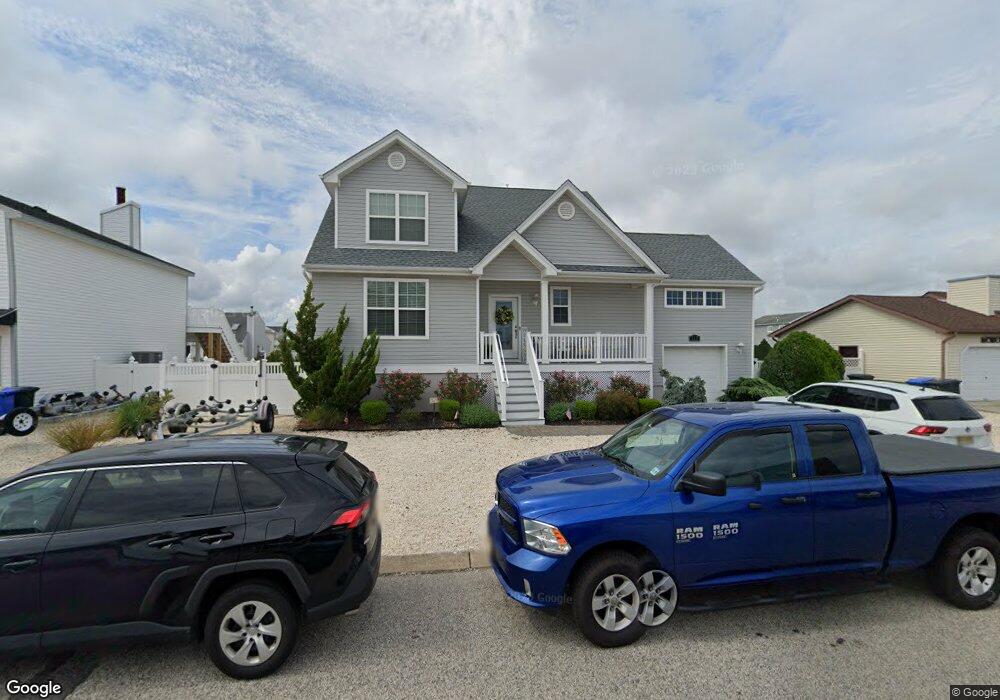
117 Jeremy Ln Manahawkin, NJ 08050
Stafford NeighborhoodEstimated Value: $859,000 - $1,282,000
2
Beds
1
Bath
1,130
Sq Ft
$893/Sq Ft
Est. Value
About This Home
This home is located at 117 Jeremy Ln, Manahawkin, NJ 08050 and is currently estimated at $1,008,941, approximately $892 per square foot. 117 Jeremy Ln is a home located in Ocean County with nearby schools including Oxycocus Elementary School, Ocean Acres Elementary School, and McKinley Avenue Elementary School.
Ownership History
Date
Name
Owned For
Owner Type
Purchase Details
Closed on
May 17, 2011
Sold by
Barfoot William J and Barfoot Frances M
Bought by
Patire Joseph Alan and Patire Rosalyn
Current Estimated Value
Home Financials for this Owner
Home Financials are based on the most recent Mortgage that was taken out on this home.
Original Mortgage
$240,000
Outstanding Balance
$167,249
Interest Rate
4.94%
Mortgage Type
New Conventional
Estimated Equity
$841,692
Purchase Details
Closed on
Mar 19, 2010
Sold by
Barfoot William J and Barfoot Frances M
Bought by
Barfoot William J and Barfoot Frances M
Purchase Details
Closed on
Feb 15, 2006
Sold by
Engell Darren S and Engell Christa
Bought by
Barfoot William and Barfoot Frances M
Home Financials for this Owner
Home Financials are based on the most recent Mortgage that was taken out on this home.
Original Mortgage
$155,479
Interest Rate
6.15%
Mortgage Type
Fannie Mae Freddie Mac
Create a Home Valuation Report for This Property
The Home Valuation Report is an in-depth analysis detailing your home's value as well as a comparison with similar homes in the area
Home Values in the Area
Average Home Value in this Area
Purchase History
| Date | Buyer | Sale Price | Title Company |
|---|---|---|---|
| Patire Joseph Alan | $308,500 | First American Title Ins Co | |
| Barfoot William J | -- | None Available | |
| Barfoot William | $399,900 | Commonwealth Land Title Insu |
Source: Public Records
Mortgage History
| Date | Status | Borrower | Loan Amount |
|---|---|---|---|
| Open | Patire Joseph Alan | $240,000 | |
| Previous Owner | Barfoot William | $155,479 |
Source: Public Records
Tax History Compared to Growth
Tax History
| Year | Tax Paid | Tax Assessment Tax Assessment Total Assessment is a certain percentage of the fair market value that is determined by local assessors to be the total taxable value of land and additions on the property. | Land | Improvement |
|---|---|---|---|---|
| 2025 | $10,503 | $423,000 | $198,700 | $224,300 |
| 2024 | $10,402 | $423,000 | $198,700 | $224,300 |
| 2023 | $9,957 | $423,000 | $198,700 | $224,300 |
| 2022 | $9,790 | $415,900 | $198,700 | $217,200 |
| 2021 | $9,657 | $415,900 | $198,700 | $217,200 |
| 2020 | $9,670 | $415,900 | $198,700 | $217,200 |
| 2019 | $9,532 | $415,900 | $198,700 | $217,200 |
| 2018 | $9,474 | $415,900 | $198,700 | $217,200 |
| 2017 | $9,221 | $391,900 | $179,800 | $212,100 |
| 2016 | $9,127 | $391,900 | $179,800 | $212,100 |
| 2015 | $8,806 | $189,800 | $179,800 | $10,000 |
| 2014 | $4,284 | $188,300 | $177,400 | $10,900 |
Source: Public Records
Map
Nearby Homes