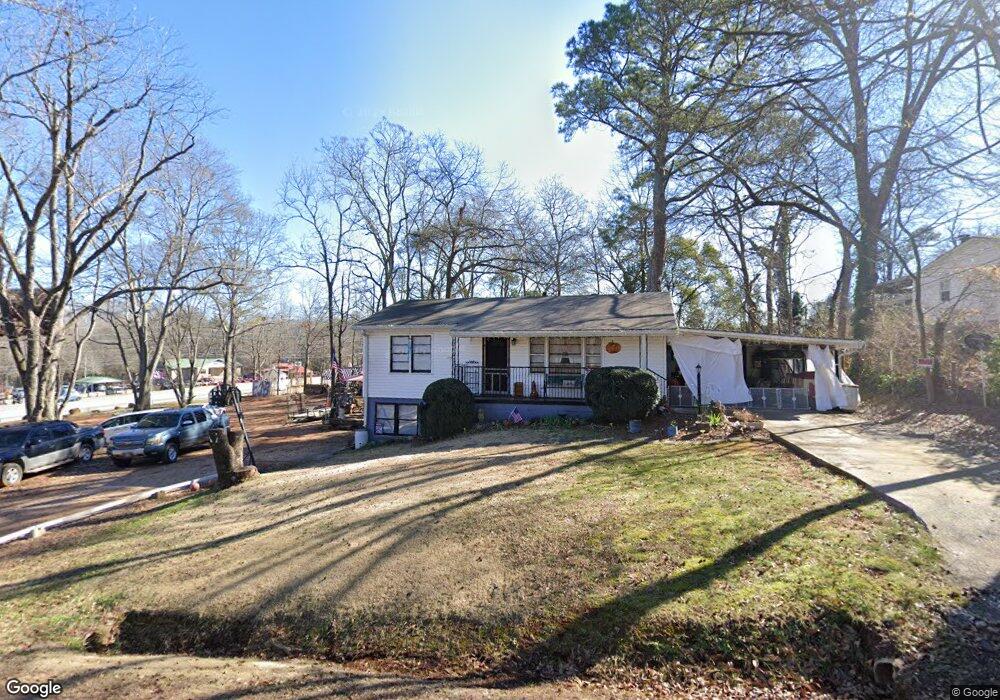
117 Johnson Dr Athens, GA 30605
Estimated Value: $282,167 - $365,000
4
Beds
2
Baths
1,728
Sq Ft
$188/Sq Ft
Est. Value
About This Home
This home is located at 117 Johnson Dr, Athens, GA 30605 and is currently estimated at $325,042, approximately $188 per square foot. 117 Johnson Dr is a home located in Clarke County with nearby schools including Gaines Elementary School, Hilsman Middle School, and Cedar Shoals High School.
Ownership History
Date
Name
Owned For
Owner Type
Purchase Details
Closed on
Oct 1, 2020
Sold by
Henderson Investment Properties Lllp
Bought by
Grier Daniel
Current Estimated Value
Home Financials for this Owner
Home Financials are based on the most recent Mortgage that was taken out on this home.
Original Mortgage
$97,444
Outstanding Balance
$47,508
Interest Rate
2.9%
Mortgage Type
New Conventional
Estimated Equity
$277,534
Purchase Details
Closed on
Sep 17, 1997
Sold by
Henderson Martha and Henderson Stanley H
Bought by
Henderson Investment Properties L L L P
Purchase Details
Closed on
Jan 6, 1993
Sold by
Henderson Martha
Bought by
Henderson Martha
Purchase Details
Closed on
Jun 20, 1990
Sold by
Henderson Stanley H and Henderson Martha
Bought by
Henderson Martha
Create a Home Valuation Report for This Property
The Home Valuation Report is an in-depth analysis detailing your home's value as well as a comparison with similar homes in the area
Home Values in the Area
Average Home Value in this Area
Purchase History
| Date | Buyer | Sale Price | Title Company |
|---|---|---|---|
| Grier Daniel | $100,000 | -- | |
| Henderson Investment Properties L L L P | -- | -- | |
| Henderson Martha | -- | -- | |
| Henderson Martha | -- | -- | |
| Henderson Martha | -- | -- |
Source: Public Records
Mortgage History
| Date | Status | Borrower | Loan Amount |
|---|---|---|---|
| Open | Grier Daniel | $97,444 |
Source: Public Records
Tax History Compared to Growth
Tax History
| Year | Tax Paid | Tax Assessment Tax Assessment Total Assessment is a certain percentage of the fair market value that is determined by local assessors to be the total taxable value of land and additions on the property. | Land | Improvement |
|---|---|---|---|---|
| 2025 | $1,900 | $61,178 | $42,588 | $18,590 |
| 2024 | $1,900 | $60,575 | $42,588 | $17,987 |
| 2023 | $1,893 | $59,972 | $42,588 | $17,384 |
| 2022 | $1,707 | $53,506 | $38,329 | $15,177 |
| 2021 | $1,348 | $52,348 | $38,329 | $14,019 |
| 2020 | $1,785 | $52,966 | $38,329 | $14,637 |
| 2019 | $1,798 | $52,966 | $38,329 | $14,637 |
| 2018 | $1,798 | $52,966 | $38,329 | $14,637 |
| 2017 | $1,822 | $53,675 | $39,038 | $14,637 |
| 2016 | $1,822 | $53,675 | $39,038 | $14,637 |
| 2015 | $1,825 | $53,675 | $39,038 | $14,637 |
| 2014 | $1,828 | $53,675 | $39,038 | $14,637 |
Source: Public Records
Map
Nearby Homes
- 119 Johnson Dr
- 120 Johnson Dr
- 125 Johnson Dr
- 130 Johnson Dr
- 130 Johnson Dr
- 112 Indiana Ave
- 114 Indiana Ave
- 116 Indiana Ave
- 114 Indiana Ave
- 118 Indiana Ave
- 140 Johnson Dr
- 1612 Lexington Rd
- 130 Indiana Ave
- 132 Indiana Ave
- 134 Indiana Ave
- 149 Johnson Dr
- 146 Johnson Dr
- 1610 Lexington Rd
- 174 Indiana Ave
- 115 Indiana Ave