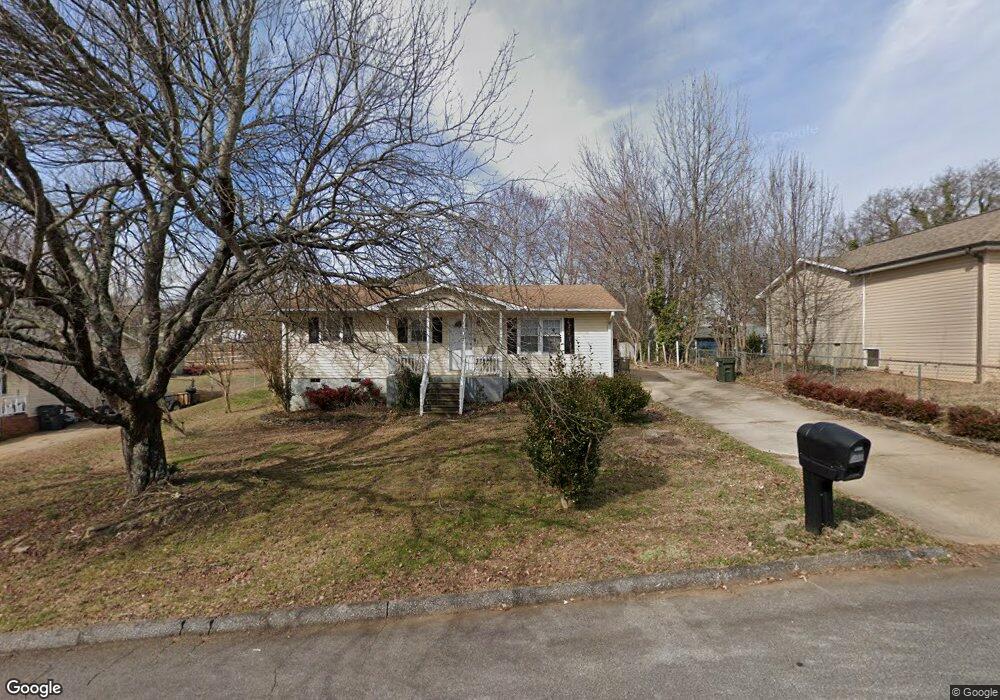
117 Johnson St Duncan, SC 29334
Estimated Value: $183,000 - $193,879
3
Beds
2
Baths
1,008
Sq Ft
$185/Sq Ft
Est. Value
About This Home
This home is located at 117 Johnson St, Duncan, SC 29334 and is currently estimated at $186,220, approximately $184 per square foot. 117 Johnson St is a home located in Spartanburg County with nearby schools including Duncan Elementary School, Byrnes Freshman Academy, and Beech Springs Intermediate School.
Ownership History
Date
Name
Owned For
Owner Type
Purchase Details
Closed on
Jul 25, 2021
Sold by
Lewis Robert W
Bought by
Roberts Cathy Ann
Current Estimated Value
Home Financials for this Owner
Home Financials are based on the most recent Mortgage that was taken out on this home.
Original Mortgage
$152,525
Outstanding Balance
$138,603
Interest Rate
3%
Mortgage Type
New Conventional
Estimated Equity
$47,617
Purchase Details
Closed on
Oct 7, 2009
Sold by
Borghi Daniel and Borghi Rebekah
Bought by
Lewis Robert W
Home Financials for this Owner
Home Financials are based on the most recent Mortgage that was taken out on this home.
Original Mortgage
$78,540
Interest Rate
5.03%
Mortgage Type
Future Advance Clause Open End Mortgage
Purchase Details
Closed on
Apr 1, 2002
Sold by
Central Carolina Bank & Trust Company
Bought by
Borghi Daniel and Borghi Rebekah
Purchase Details
Closed on
Feb 13, 2002
Sold by
Hendrix Charles G
Bought by
Central Carolina Bank & Trust Company
Create a Home Valuation Report for This Property
The Home Valuation Report is an in-depth analysis detailing your home's value as well as a comparison with similar homes in the area
Home Values in the Area
Average Home Value in this Area
Purchase History
We collect this data history from publicly available records. To have your information removed, we recommend requesting removal directly through your county’s website.
| Date | Buyer | Sale Price | Title Company |
|---|---|---|---|
| Roberts Cathy Ann | $151,000 | None Available | |
| Lewis Robert W | $77,000 | -- | |
| Borghi Daniel | $51,000 | -- | |
| Central Carolina Bank & Trust Company | $20,000 | -- |
Source: Public Records
Mortgage History
We collect this data history from publicly available records. To have your information removed, we recommend requesting removal directly through your county’s website.
| Date | Status | Borrower | Loan Amount |
|---|---|---|---|
| Open | Roberts Cathy Ann | $152,525 | |
| Previous Owner | Lewis Robert W | $78,540 |
Source: Public Records
Tax History
| Year | Tax Paid | Tax Assessment Tax Assessment Total Assessment is a certain percentage of the fair market value that is determined by local assessors to be the total taxable value of land and additions on the property. | Land | Improvement |
|---|---|---|---|---|
| 2025 | $1,384 | $6,016 | $948 | $5,068 |
| 2024 | $1,384 | $6,016 | $948 | $5,068 |
| 2023 | $1,384 | $6,016 | $948 | $5,068 |
| 2022 | $1,416 | $6,040 | $600 | $5,440 |
| 2021 | $819 | $3,298 | $582 | $2,716 |
| 2020 | $805 | $3,298 | $582 | $2,716 |
| 2019 | $798 | $3,298 | $582 | $2,716 |
| 2018 | $761 | $3,298 | $582 | $2,716 |
| 2017 | $687 | $2,868 | $600 | $2,268 |
| 2016 | $666 | $2,868 | $600 | $2,268 |
| 2015 | $652 | $2,868 | $600 | $2,268 |
| 2014 | $645 | $2,868 | $600 | $2,268 |
Source: Public Records
Map
Nearby Homes
- 253 S Church St Extension
- 124 Lyman Ave
- 128 Lyman Ave
- 101 Parker St
- 290 Forest Lake Rd
- 296 Forest Lake Rd
- 521 S Spencer St
- 110 W Main St
- 123 W Main St
- 0 S Danzler Rd Unit 7362340
- 728 Cannonsburg Dr
- 719 Cannonsburg Dr
- 100 Holly Dr
- 31 Campbell St
- 115 Cooley St
- 208 Ashley Danielle Dr
- 108 Piedmont St
- 211 Brookside Dr
- 2005 Silverwalk Ct
- 1117 Syrah Ln
- 119 Johnson St
- 115 Johnson St
- 148 Christopher St
- 150 Christopher St
- 146 Christopher St
- 113 Johnson St
- 121 Johnson St
- 118 Johnson St
- 152 Christopher St
- 120 Johnson St
- 144 Christopher St
- 122 Johnson St
- 111 Johnson St
- 154 Christopher St
- 114 Johnson St
- 123 Johnson St
- 142 Christopher St
- 112 Johnson St
- 157 Christopher St
- 156 Christopher St
Your Personal Tour Guide
Ask me questions while you tour the home.