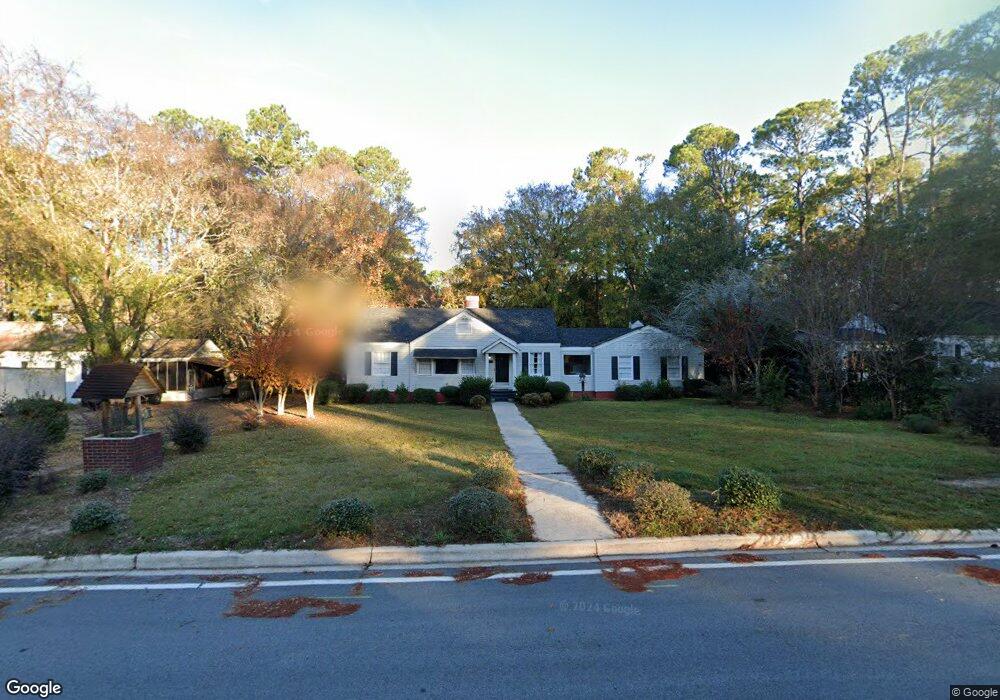
117 King St Tifton, GA 31794
Estimated Value: $195,000 - $259,000
3
Beds
2
Baths
1,738
Sq Ft
$129/Sq Ft
Est. Value
About This Home
This home is located at 117 King St, Tifton, GA 31794 and is currently estimated at $223,817, approximately $128 per square foot. 117 King St is a home located in Tift County with nearby schools including Len Lastinger Primary School, Charles Spencer Elementary School, and J.T. Reddick School.
Ownership History
Date
Name
Owned For
Owner Type
Purchase Details
Closed on
Feb 23, 2018
Sold by
Atwater Land
Bought by
Bryant Leigh
Current Estimated Value
Home Financials for this Owner
Home Financials are based on the most recent Mortgage that was taken out on this home.
Original Mortgage
$131,212
Outstanding Balance
$111,568
Interest Rate
4.15%
Mortgage Type
New Conventional
Estimated Equity
$112,249
Purchase Details
Closed on
Mar 16, 2017
Bought by
Atwater Land
Purchase Details
Closed on
Jul 5, 2016
Sold by
Kevin
Bought by
Us Bank Na Suc Trustee
Purchase Details
Closed on
Apr 30, 2004
Sold by
Moore Eileen T Nka Brogdon
Bought by
May Kevin and May Karen
Purchase Details
Closed on
Sep 21, 1994
Sold by
Dicks Staceyd and Hillman Teena D
Bought by
Moore Eileen T
Purchase Details
Closed on
Sep 8, 1994
Sold by
Dividson Kermit D Estate
Bought by
Dicks Stacey D and Hillman Teena D
Purchase Details
Closed on
Mar 10, 1992
Sold by
Davidson Kermit D
Bought by
Davidson Helen D
Create a Home Valuation Report for This Property
The Home Valuation Report is an in-depth analysis detailing your home's value as well as a comparison with similar homes in the area
Home Values in the Area
Average Home Value in this Area
Purchase History
| Date | Buyer | Sale Price | Title Company |
|---|---|---|---|
| Bryant Leigh | $129,900 | -- | |
| Atwater Land | $32,500 | -- | |
| Us Bank Na Suc Trustee | -- | -- | |
| May Kevin | $88,000 | -- | |
| Moore Eileen T | $55,000 | -- | |
| Dicks Stacey D | -- | -- | |
| Davidson Helen D | -- | -- |
Source: Public Records
Mortgage History
| Date | Status | Borrower | Loan Amount |
|---|---|---|---|
| Open | Bryant Leigh | $131,212 |
Source: Public Records
Tax History Compared to Growth
Tax History
| Year | Tax Paid | Tax Assessment Tax Assessment Total Assessment is a certain percentage of the fair market value that is determined by local assessors to be the total taxable value of land and additions on the property. | Land | Improvement |
|---|---|---|---|---|
| 2024 | $1,976 | $73,265 | $12,000 | $61,265 |
| 2023 | $1,785 | $35,388 | $4,000 | $31,388 |
| 2022 | $1,332 | $35,388 | $4,000 | $31,388 |
| 2021 | $1,340 | $35,388 | $4,000 | $31,388 |
| 2020 | $1,374 | $35,388 | $4,000 | $31,388 |
| 2019 | $1,374 | $35,388 | $4,000 | $31,388 |
| 2018 | $1,368 | $35,224 | $4,000 | $31,224 |
| 2017 | $1,404 | $35,224 | $4,000 | $31,224 |
| 2016 | $1,248 | $35,224 | $4,000 | $31,224 |
| 2015 | $1,249 | $35,224 | $4,000 | $31,224 |
| 2014 | $1,251 | $35,224 | $4,000 | $31,224 |
| 2013 | -- | $35,224 | $4,000 | $31,224 |
Source: Public Records
Map
Nearby Homes
- 307 Fulwood Blvd
- 225 Alabama Dr
- 711 10th St W
- 0 Penn Place
- 523 Alabama Dr Unit 15 & PT 16
- 523 Alabama Dr
- 0 Lee Ball Rd
- 803 Forest Ave
- 803 Forrest Ave
- 821 Murray Ave
- 1601 Murray Ave
- 2021 Emory Dr
- 0 N U S Hwy 41
- 2202 Emory Dr
- 1617 Wilson Ave N
- 416 6th St W
- 801 Ridge Ave N
- 2609 Emmett Dr
- 15 acres Us Highway 41
- 33.7 ac Us Highway 41