117 Long Shadow Place Durham, NC 27713
Woodcroft NeighborhoodEstimated Value: $315,000 - $330,000
3
Beds
3
Baths
1,520
Sq Ft
$212/Sq Ft
Est. Value
About This Home
This home is located at 117 Long Shadow Place, Durham, NC 27713 and is currently estimated at $321,841, approximately $211 per square foot. 117 Long Shadow Place is a home located in Durham County with nearby schools including Southwest Elementary School, Morehead Montessori, and Sherwood Githens Middle.
Ownership History
Date
Name
Owned For
Owner Type
Purchase Details
Closed on
Aug 11, 2023
Sold by
Tribley Lvingston Nancy
Bought by
Nancy Tribley Livingston Revocable Trust and Livingston
Current Estimated Value
Purchase Details
Closed on
Dec 22, 2006
Sold by
Reyes Conrad Santiago and Reyes Rebecca
Bought by
Livingston William C and Livingston Nancy T
Home Financials for this Owner
Home Financials are based on the most recent Mortgage that was taken out on this home.
Original Mortgage
$112,000
Interest Rate
6.1%
Mortgage Type
Purchase Money Mortgage
Purchase Details
Closed on
Nov 18, 1998
Sold by
Hanson Lynda L
Bought by
Reyes Conrad Santiago
Home Financials for this Owner
Home Financials are based on the most recent Mortgage that was taken out on this home.
Original Mortgage
$111,503
Interest Rate
6.87%
Mortgage Type
FHA
Create a Home Valuation Report for This Property
The Home Valuation Report is an in-depth analysis detailing your home's value as well as a comparison with similar homes in the area
Home Values in the Area
Average Home Value in this Area
Purchase History
| Date | Buyer | Sale Price | Title Company |
|---|---|---|---|
| Nancy Tribley Livingston Revocable Trust | -- | None Listed On Document | |
| Livingston William C | $140,000 | None Available | |
| Reyes Conrad Santiago | $112,000 | -- |
Source: Public Records
Mortgage History
| Date | Status | Borrower | Loan Amount |
|---|---|---|---|
| Previous Owner | Livingston William C | $112,000 | |
| Previous Owner | Reyes Conrad Santiago | $111,503 |
Source: Public Records
Tax History Compared to Growth
Tax History
| Year | Tax Paid | Tax Assessment Tax Assessment Total Assessment is a certain percentage of the fair market value that is determined by local assessors to be the total taxable value of land and additions on the property. | Land | Improvement |
|---|---|---|---|---|
| 2025 | $3,249 | $327,728 | $75,000 | $252,728 |
| 2024 | $2,223 | $159,401 | $30,000 | $129,401 |
| 2023 | $2,088 | $159,401 | $30,000 | $129,401 |
| 2022 | $2,040 | $159,401 | $30,000 | $129,401 |
| 2021 | $2,031 | $159,401 | $30,000 | $129,401 |
| 2020 | $1,983 | $159,401 | $30,000 | $129,401 |
| 2019 | $1,983 | $159,401 | $30,000 | $129,401 |
| 2018 | $1,818 | $134,053 | $25,000 | $109,053 |
| 2017 | $1,805 | $134,053 | $25,000 | $109,053 |
| 2016 | $1,744 | $134,053 | $25,000 | $109,053 |
| 2015 | $1,977 | $142,836 | $27,800 | $115,036 |
| 2014 | $1,977 | $142,836 | $27,800 | $115,036 |
Source: Public Records
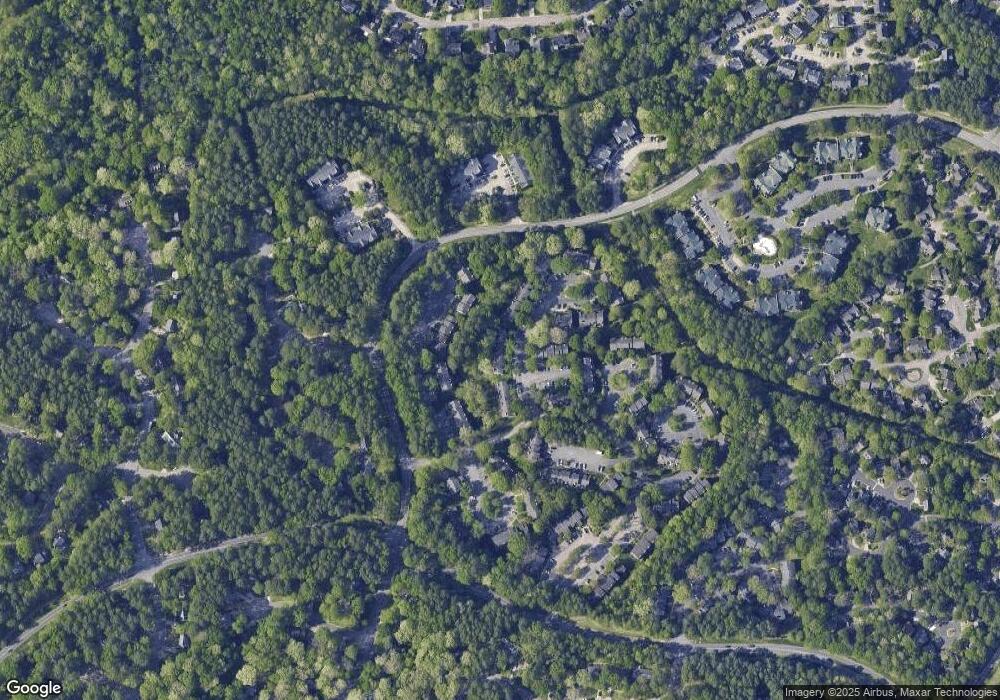
Map
Nearby Homes
- 121 Long Shadow Place
- 116 Long Shadow Place
- 118 Old Maple Ln
- 108 Hollow Oak Dr
- 8 Briarfield Ct
- 107 Weathersfield Dr
- 5219 Oakbrook Dr
- 3702 Chimney Ridge Place Unit 8
- 3706 Chimney Ridge Place Unit 8
- 7 Old Towne Place
- 14 W Bridlewood Trail
- 4 Barkridge Ct
- 18 W Bridlewood Trail
- 10 Hickorywood Square
- 517 Woodwinds Dr
- 701 Cross Timbers Dr
- 703 Cross Timbers Dr
- 616 Cross Timbers Dr
- 4 Applewood Square
- 7 Applewood Square
- 115 Long Shadow Place
- 113 Long Shadow Place
- 119 Long Shadow Place
- 111 Long Shadow Place
- 109 Long Shadow Place
- 107 Long Shadow Place
- 123 Long Shadow Place
- 105 Long Shadow Place
- 103 Long Shadow Place
- 120 Long Shadow Place
- 127 Long Shadow Place
- 128 Timber Ridge Dr
- 124 Timber Ridge Dr
- 126 Timber Ridge Dr
- 122 Timber Ridge Dr
- 112 Timber Ridge Dr
- 114 Timber Ridge Dr
- 116 Timber Ridge Dr
- 101 Long Shadow Place
- 120 Timber Ridge Dr