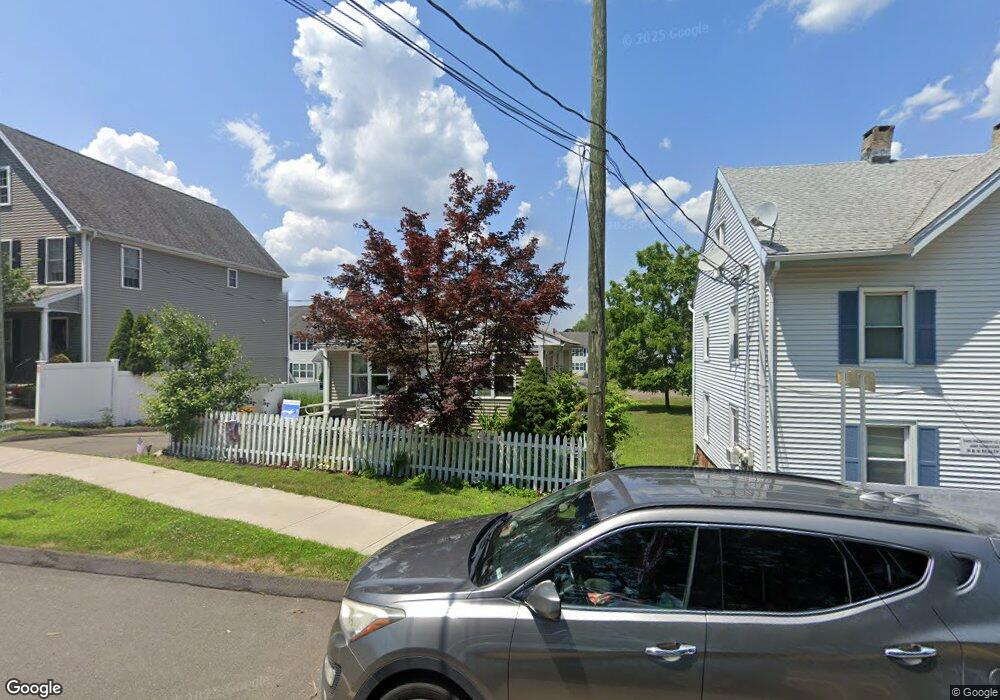
117 Main St East Haven, CT 06512
Estimated Value: $300,000 - $464,000
3
Beds
1
Bath
927
Sq Ft
$370/Sq Ft
Est. Value
About This Home
This home is located at 117 Main St, East Haven, CT 06512 and is currently estimated at $343,103, approximately $370 per square foot. 117 Main St is a home located in New Haven County with nearby schools including East Haven High School and Pathway School.
Ownership History
Date
Name
Owned For
Owner Type
Purchase Details
Closed on
Mar 10, 2020
Sold by
Fc Russo Family Llc
Bought by
125 Main Llc
Current Estimated Value
Purchase Details
Closed on
Jun 20, 2019
Sold by
Fc Russo Family Llc
Bought by
125 Main Llc
Purchase Details
Closed on
Jun 30, 2009
Sold by
Silverman Tr Francis E and Silverman Evelyn
Bought by
Fc Russo Family Llc
Home Financials for this Owner
Home Financials are based on the most recent Mortgage that was taken out on this home.
Original Mortgage
$180,000
Interest Rate
4.92%
Create a Home Valuation Report for This Property
The Home Valuation Report is an in-depth analysis detailing your home's value as well as a comparison with similar homes in the area
Home Values in the Area
Average Home Value in this Area
Purchase History
| Date | Buyer | Sale Price | Title Company |
|---|---|---|---|
| 125 Main Llc | $3,000,000 | None Available | |
| 125 Main Llc | $3,000,000 | -- | |
| Fc Russo Family Llc | $200,000 | -- |
Source: Public Records
Mortgage History
| Date | Status | Borrower | Loan Amount |
|---|---|---|---|
| Previous Owner | Fc Russo Family Llc | $180,000 |
Source: Public Records
Tax History Compared to Growth
Tax History
| Year | Tax Paid | Tax Assessment Tax Assessment Total Assessment is a certain percentage of the fair market value that is determined by local assessors to be the total taxable value of land and additions on the property. | Land | Improvement |
|---|---|---|---|---|
| 2025 | $3,883 | $116,130 | $42,000 | $74,130 |
| 2024 | $3,883 | $116,130 | $42,000 | $74,130 |
| 2023 | $3,623 | $116,130 | $42,000 | $74,130 |
| 2022 | $3,623 | $116,130 | $42,000 | $74,130 |
| 2021 | $3,175 | $92,690 | $40,130 | $52,560 |
| 2020 | $3,175 | $92,690 | $40,130 | $52,560 |
| 2019 | $3,005 | $92,690 | $40,130 | $52,560 |
| 2018 | $3,008 | $92,690 | $40,130 | $52,560 |
| 2017 | $2,924 | $92,690 | $40,130 | $52,560 |
| 2016 | $3,279 | $103,920 | $43,220 | $60,700 |
| 2015 | $3,279 | $103,920 | $43,220 | $60,700 |
| 2014 | $3,331 | $103,920 | $43,220 | $60,700 |
Source: Public Records
Map
Nearby Homes