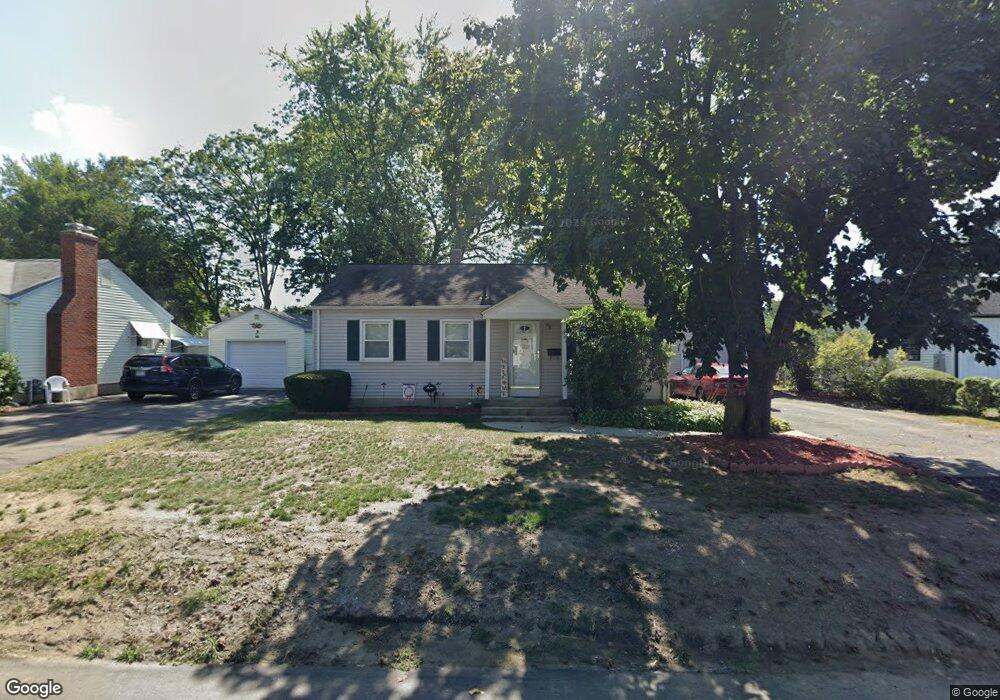
117 Manning St Chicopee, MA 01020
Fairview NeighborhoodEstimated Value: $285,106 - $316,000
3
Beds
1
Bath
864
Sq Ft
$345/Sq Ft
Est. Value
About This Home
This home is located at 117 Manning St, Chicopee, MA 01020 and is currently estimated at $298,277, approximately $345 per square foot. 117 Manning St is a home located in Hampden County with nearby schools including Streiber Elementary School, Fairview Middle School, and Chicopee Comprehensive High School.
Ownership History
Date
Name
Owned For
Owner Type
Purchase Details
Closed on
Jul 1, 1997
Sold by
Crayg Homes Inc
Bought by
Perez Eulogio F and Perez Kathleen C
Current Estimated Value
Home Financials for this Owner
Home Financials are based on the most recent Mortgage that was taken out on this home.
Original Mortgage
$96,000
Interest Rate
7.81%
Mortgage Type
Purchase Money Mortgage
Purchase Details
Closed on
Feb 21, 1997
Sold by
Department Of Housing & Urban Dev
Bought by
Crayg Home Inc
Purchase Details
Closed on
Sep 11, 1996
Sold by
Haggerty Bruce D and Colon Yvonne F
Bought by
Fleet Mortgage Corp
Purchase Details
Closed on
Jan 30, 1989
Sold by
Brown Mary A
Bought by
Colon Yvonne F
Create a Home Valuation Report for This Property
The Home Valuation Report is an in-depth analysis detailing your home's value as well as a comparison with similar homes in the area
Home Values in the Area
Average Home Value in this Area
Purchase History
| Date | Buyer | Sale Price | Title Company |
|---|---|---|---|
| Perez Eulogio F | $99,000 | -- | |
| Crayg Home Inc | $57,000 | -- | |
| Fleet Mortgage Corp | $112,783 | -- | |
| Colon Yvonne F | $104,000 | -- |
Source: Public Records
Mortgage History
| Date | Status | Borrower | Loan Amount |
|---|---|---|---|
| Open | Colon Yvonne F | $94,500 | |
| Closed | Colon Yvonne F | $87,000 | |
| Closed | Colon Yvonne F | $96,000 |
Source: Public Records
Tax History
| Year | Tax Paid | Tax Assessment Tax Assessment Total Assessment is a certain percentage of the fair market value that is determined by local assessors to be the total taxable value of land and additions on the property. | Land | Improvement |
|---|---|---|---|---|
| 2025 | $3,546 | $233,900 | $101,800 | $132,100 |
| 2024 | $3,365 | $228,000 | $99,800 | $128,200 |
| 2023 | $3,127 | $206,400 | $90,700 | $115,700 |
| 2022 | $3,040 | $178,900 | $78,900 | $100,000 |
| 2021 | $2,885 | $163,800 | $71,700 | $92,100 |
| 2020 | $2,790 | $159,800 | $73,700 | $86,100 |
| 2019 | $2,762 | $153,800 | $73,700 | $80,100 |
| 2018 | $2,695 | $147,200 | $70,200 | $77,000 |
| 2017 | $2,496 | $144,200 | $65,900 | $78,300 |
| 2016 | $2,295 | $135,700 | $65,900 | $69,800 |
| 2015 | $2,399 | $136,800 | $65,900 | $70,900 |
| 2014 | $1,200 | $136,800 | $65,900 | $70,900 |
Source: Public Records
Map
Nearby Homes
- 15 Hudson Ave
- 61 Saint Jacques Ave
- 341 Montcalm St
- 81 Mccarthy Ave
- 143 Royal St
- 18 Devlin Dr
- 83 Old Farm Rd
- 128 Ann St
- 41 Susan Ave
- 90 Anson St
- 442 Prospect St
- 460 Irene St
- 2085 Memorial Dr
- 35 Ludlow Rd
- 104 Johnson Rd Unit 1103
- 104 Johnson Rd Unit 707
- 58 Robinridge Rd
- 119 Oakridge St
- 210 Johnson Rd Unit 23
- 37 Greenwood Terrace
- 123 Manning St
- 111 Manning St
- 66 Harrington Rd
- 131 Manning St
- 103 Manning St
- 74 Harrington Rd
- 58 Harrington Rd
- 114 Manning St
- 122 Manning St
- 108 Manning St
- 80 Harrington Rd
- 52 Harrington Rd
- 137 Manning St
- 95 Manning St
- 128 Manning St
- 100 Manning St
- 136 Manning St
- 44 Harrington Rd
- 43 Barby Ave
- 94 Manning St
Your Personal Tour Guide
Ask me questions while you tour the home.