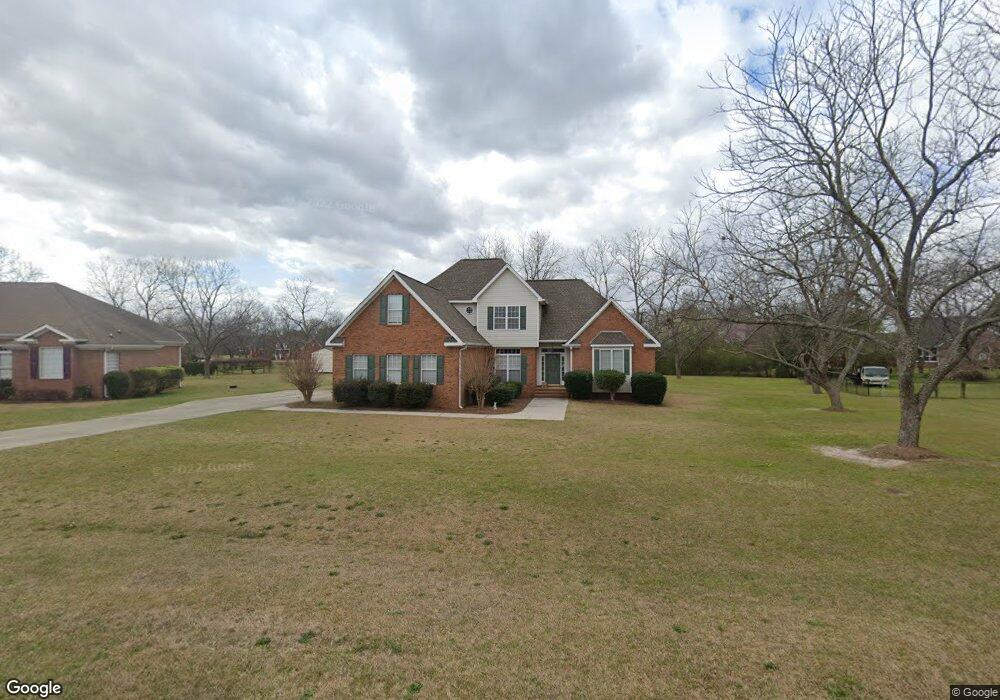
117 Matt Dr Macon, GA 31216
Estimated Value: $299,000 - $333,000
3
Beds
3
Baths
2,326
Sq Ft
$136/Sq Ft
Est. Value
About This Home
This home is located at 117 Matt Dr, Macon, GA 31216 and is currently estimated at $316,105, approximately $135 per square foot. 117 Matt Dr is a home located in Bibb County with nearby schools including Porter Elementary School, Rutland Middle School, and Rutland High School.
Ownership History
Date
Name
Owned For
Owner Type
Purchase Details
Closed on
Jun 21, 2006
Sold by
Nelson Michael R and Nelson Lisa D
Bought by
Little Donald L and Little Sandra L
Current Estimated Value
Home Financials for this Owner
Home Financials are based on the most recent Mortgage that was taken out on this home.
Original Mortgage
$147,500
Outstanding Balance
$85,865
Interest Rate
6.49%
Mortgage Type
New Conventional
Estimated Equity
$230,240
Purchase Details
Closed on
Sep 30, 1999
Purchase Details
Closed on
Mar 23, 1998
Create a Home Valuation Report for This Property
The Home Valuation Report is an in-depth analysis detailing your home's value as well as a comparison with similar homes in the area
Home Values in the Area
Average Home Value in this Area
Purchase History
| Date | Buyer | Sale Price | Title Company |
|---|---|---|---|
| Little Donald L | $207,500 | None Avelable | |
| -- | $171,000 | -- | |
| -- | $25,000 | -- |
Source: Public Records
Mortgage History
| Date | Status | Borrower | Loan Amount |
|---|---|---|---|
| Open | Little Donald L | $147,500 |
Source: Public Records
Tax History Compared to Growth
Tax History
| Year | Tax Paid | Tax Assessment Tax Assessment Total Assessment is a certain percentage of the fair market value that is determined by local assessors to be the total taxable value of land and additions on the property. | Land | Improvement |
|---|---|---|---|---|
| 2025 | $2,851 | $122,999 | $12,000 | $110,999 |
| 2024 | $2,931 | $122,411 | $12,000 | $110,411 |
| 2023 | $2,226 | $112,661 | $10,000 | $102,661 |
| 2022 | $3,141 | $97,727 | $10,000 | $87,727 |
| 2021 | $2,703 | $78,121 | $10,000 | $68,121 |
| 2020 | $2,761 | $78,121 | $10,000 | $68,121 |
| 2019 | $2,784 | $78,121 | $10,000 | $68,121 |
| 2018 | $4,410 | $77,552 | $10,000 | $67,552 |
| 2017 | $2,643 | $77,552 | $10,000 | $67,552 |
| 2016 | $2,441 | $77,552 | $10,000 | $67,552 |
| 2015 | $3,455 | $77,552 | $10,000 | $67,552 |
| 2014 | $3,461 | $77,552 | $10,000 | $67,552 |
Source: Public Records
Map
Nearby Homes