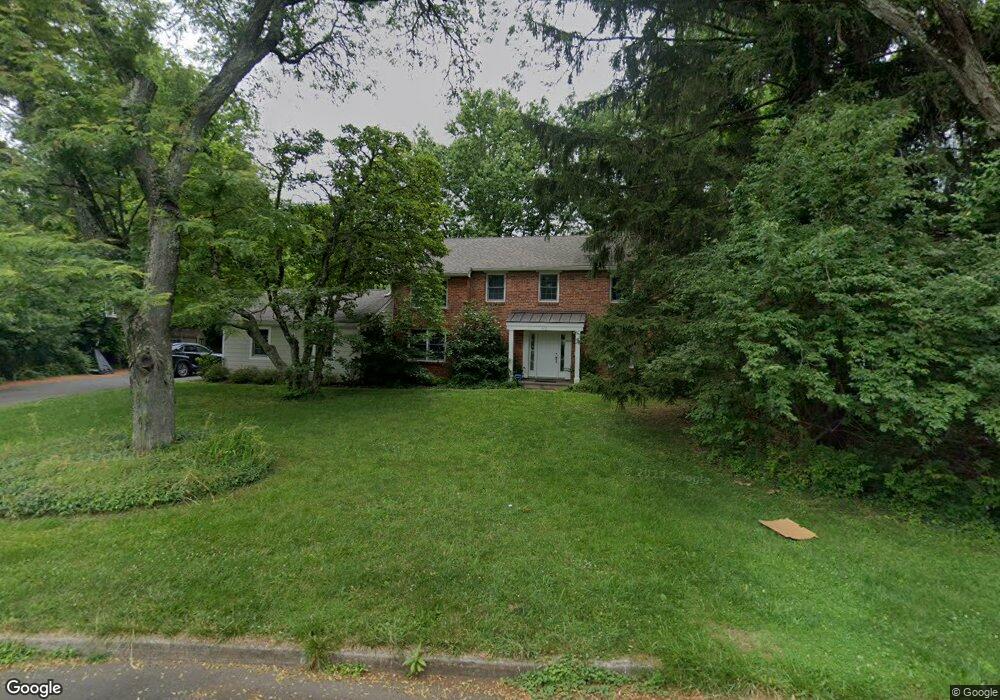
117 Mccosh Cir Princeton, NJ 08540
Estimated Value: $1,048,000 - $1,422,000
--
Bed
--
Bath
2,362
Sq Ft
$544/Sq Ft
Est. Value
About This Home
This home is located at 117 Mccosh Cir, Princeton, NJ 08540 and is currently estimated at $1,285,985, approximately $544 per square foot. 117 Mccosh Cir is a home located in Mercer County with nearby schools including Riverside Elementary School, Princeton Middle School, and Princeton High School.
Ownership History
Date
Name
Owned For
Owner Type
Purchase Details
Closed on
Aug 7, 2015
Sold by
The Trustees Of Princeton University
Bought by
Delue Rachael Z and Delue Erik N
Current Estimated Value
Home Financials for this Owner
Home Financials are based on the most recent Mortgage that was taken out on this home.
Original Mortgage
$561,033
Outstanding Balance
$465,940
Interest Rate
2.47%
Mortgage Type
Purchase Money Mortgage
Estimated Equity
$820,045
Purchase Details
Closed on
Oct 24, 2014
Sold by
Kulkarni Sanjeev R
Bought by
The Trustees Of Princeton University
Purchase Details
Closed on
May 19, 1998
Sold by
Princeton University
Bought by
Kulkarni Sanjeev and Kulkarni Marian
Home Financials for this Owner
Home Financials are based on the most recent Mortgage that was taken out on this home.
Original Mortgage
$223,840
Interest Rate
7.12%
Purchase Details
Closed on
Apr 8, 1996
Sold by
Farrington Jeremiah
Bought by
The Trustees Princeton Univ
Create a Home Valuation Report for This Property
The Home Valuation Report is an in-depth analysis detailing your home's value as well as a comparison with similar homes in the area
Home Values in the Area
Average Home Value in this Area
Purchase History
| Date | Buyer | Sale Price | Title Company |
|---|---|---|---|
| Delue Rachael Z | $660,033 | Multiple | |
| The Trustees Of Princeton University | $586,696 | None Available | |
| Kulkarni Sanjeev | $263,346 | -- | |
| The Trustees Princeton Univ | $255,000 | -- |
Source: Public Records
Mortgage History
| Date | Status | Borrower | Loan Amount |
|---|---|---|---|
| Open | Delue Rachael Z | $561,033 | |
| Previous Owner | Kulkarni Sanjeev | $223,840 |
Source: Public Records
Tax History Compared to Growth
Tax History
| Year | Tax Paid | Tax Assessment Tax Assessment Total Assessment is a certain percentage of the fair market value that is determined by local assessors to be the total taxable value of land and additions on the property. | Land | Improvement |
|---|---|---|---|---|
| 2025 | $22,960 | $862,200 | $558,000 | $304,200 |
| 2024 | $21,676 | $862,200 | $558,000 | $304,200 |
| 2023 | $21,676 | $862,200 | $558,000 | $304,200 |
| 2022 | $20,969 | $862,200 | $558,000 | $304,200 |
| 2021 | $21,029 | $862,200 | $558,000 | $304,200 |
| 2020 | $20,865 | $862,200 | $558,000 | $304,200 |
| 2019 | $20,451 | $862,200 | $558,000 | $304,200 |
| 2018 | $20,107 | $862,200 | $558,000 | $304,200 |
| 2017 | $19,831 | $862,200 | $558,000 | $304,200 |
| 2016 | $19,520 | $862,200 | $558,000 | $304,200 |
| 2015 | $17,647 | $797,800 | $508,000 | $289,800 |
| 2014 | $17,432 | $797,800 | $508,000 | $289,800 |
Source: Public Records
Map
Nearby Homes