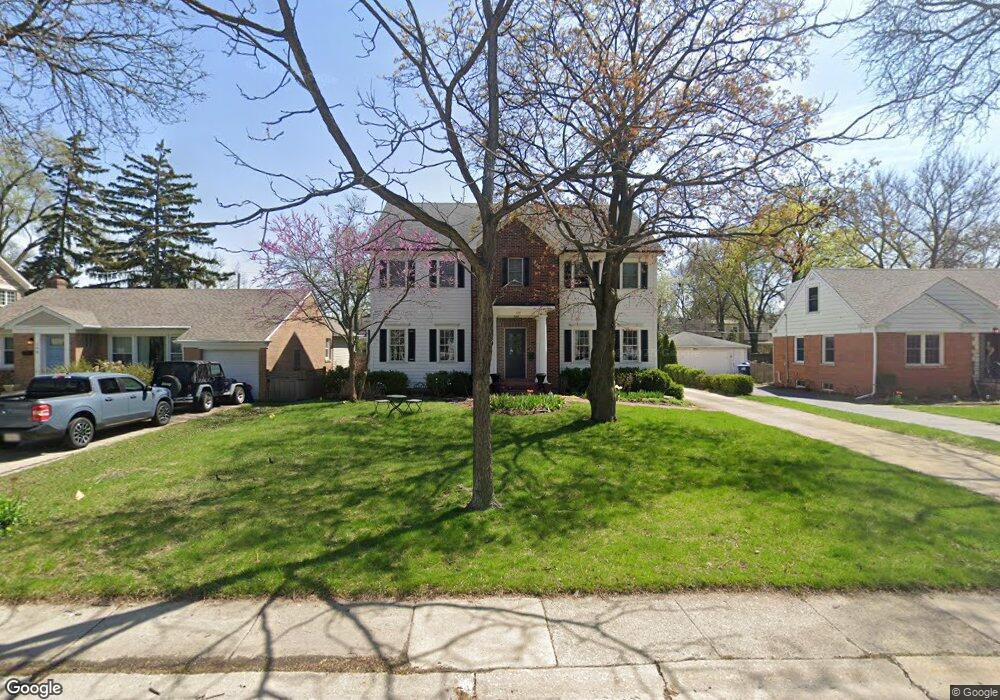
117 Mohawk Dr Clarendon Hills, IL 60514
Estimated Value: $907,000 - $1,054,000
--
Bed
1
Bath
2,886
Sq Ft
$336/Sq Ft
Est. Value
About This Home
This home is located at 117 Mohawk Dr, Clarendon Hills, IL 60514 and is currently estimated at $969,506, approximately $335 per square foot. 117 Mohawk Dr is a home located in DuPage County with nearby schools including J T Manning Elementary School, C E Miller Elementary School, and Westmont Jr High School.
Ownership History
Date
Name
Owned For
Owner Type
Purchase Details
Closed on
Mar 22, 2004
Sold by
Emmons Molly M and Schultz Molly M
Bought by
Schultz Molly
Current Estimated Value
Home Financials for this Owner
Home Financials are based on the most recent Mortgage that was taken out on this home.
Original Mortgage
$128,000
Outstanding Balance
$49,040
Interest Rate
3.12%
Mortgage Type
New Conventional
Estimated Equity
$920,466
Purchase Details
Closed on
May 25, 1999
Sold by
Guido Matthew J and Guido Alyssa R
Bought by
Emmons Molly M
Home Financials for this Owner
Home Financials are based on the most recent Mortgage that was taken out on this home.
Original Mortgage
$136,500
Interest Rate
6.92%
Purchase Details
Closed on
Jun 27, 1995
Sold by
Lacy Maricarol
Bought by
Guido Matthew J and Guido Alyssa R
Home Financials for this Owner
Home Financials are based on the most recent Mortgage that was taken out on this home.
Original Mortgage
$100,000
Interest Rate
7.5%
Create a Home Valuation Report for This Property
The Home Valuation Report is an in-depth analysis detailing your home's value as well as a comparison with similar homes in the area
Home Values in the Area
Average Home Value in this Area
Purchase History
| Date | Buyer | Sale Price | Title Company |
|---|---|---|---|
| Schultz Molly | -- | Git | |
| Emmons Molly M | $171,500 | Premier Title | |
| Guido Matthew J | $145,000 | -- |
Source: Public Records
Mortgage History
| Date | Status | Borrower | Loan Amount |
|---|---|---|---|
| Open | Schultz Molly | $128,000 | |
| Closed | Emmons Molly M | $136,500 | |
| Previous Owner | Guido Matthew J | $100,000 | |
| Closed | Schultz Molly | $142,000 |
Source: Public Records
Tax History Compared to Growth
Tax History
| Year | Tax Paid | Tax Assessment Tax Assessment Total Assessment is a certain percentage of the fair market value that is determined by local assessors to be the total taxable value of land and additions on the property. | Land | Improvement |
|---|---|---|---|---|
| 2024 | $17,047 | $279,031 | $58,991 | $220,040 |
| 2023 | $15,913 | $256,510 | $54,230 | $202,280 |
| 2022 | $15,269 | $245,230 | $51,840 | $193,390 |
| 2021 | $14,760 | $242,440 | $51,250 | $191,190 |
| 2020 | $14,497 | $237,630 | $50,230 | $187,400 |
| 2019 | $13,987 | $228,010 | $48,200 | $179,810 |
| 2018 | $14,310 | $229,260 | $48,000 | $181,260 |
| 2017 | $13,949 | $220,610 | $46,190 | $174,420 |
| 2016 | $13,764 | $210,540 | $44,080 | $166,460 |
| 2015 | $13,568 | $198,080 | $41,470 | $156,610 |
| 2014 | $12,686 | $178,750 | $40,320 | $138,430 |
| 2013 | $12,022 | $177,910 | $40,130 | $137,780 |
Source: Public Records
Map
Nearby Homes
- 403 Burlington Ave
- 226 N Wilmette Ave
- 309 E Naperville Rd
- 410 Chicago Ave
- 322 Park Ave Unit 2A
- 260 N Linden Ave
- 313 E Des Moines St
- 303 N Cass Ave
- 255 N Grant St
- 372 55th St
- 116 W Naperville Rd
- 416 N Cass Ave Unit 6
- 47 E 55th St
- 346 55th St
- 475 N Cass Ave Unit 212
- 303 Reserve Cir
- 147 Chicago Ave
- 25 S Hudson St
- 223 E 56th St
- 306 S Grant St