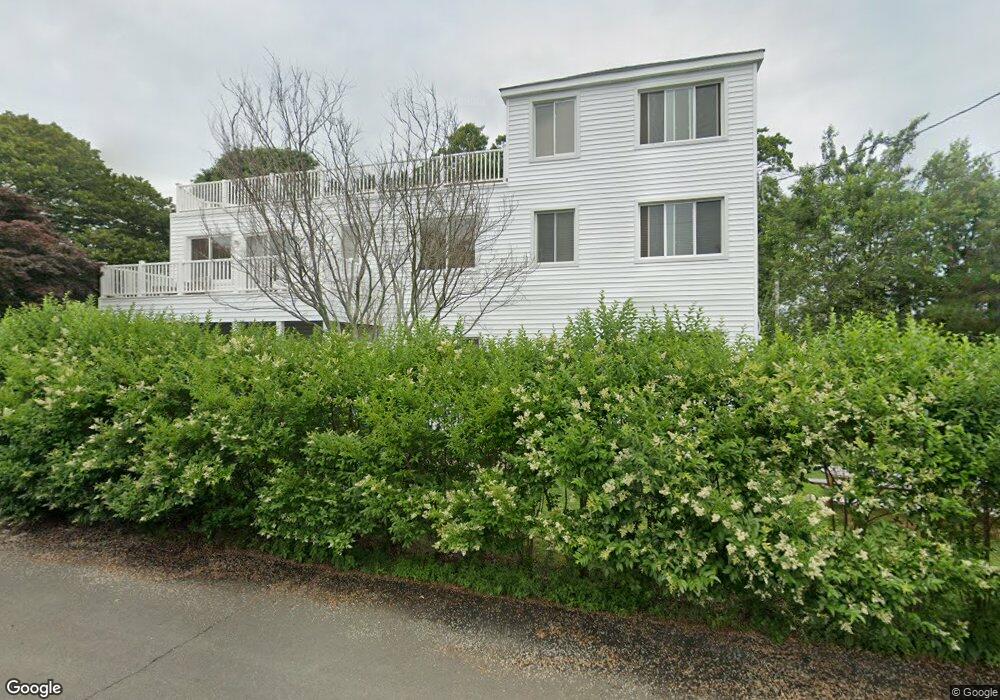
117 Morgan Ave East Haven, CT 06512
Estimated Value: $575,000 - $759,549
5
Beds
4
Baths
3,200
Sq Ft
$221/Sq Ft
Est. Value
About This Home
This home is located at 117 Morgan Ave, East Haven, CT 06512 and is currently estimated at $707,637, approximately $221 per square foot. 117 Morgan Ave is a home located in New Haven County with nearby schools including East Haven High School and Pathway School.
Ownership History
Date
Name
Owned For
Owner Type
Purchase Details
Closed on
Jul 15, 2002
Sold by
Nargi-Toth Kathleen
Bought by
Graham John O
Current Estimated Value
Home Financials for this Owner
Home Financials are based on the most recent Mortgage that was taken out on this home.
Original Mortgage
$250,000
Interest Rate
6.79%
Create a Home Valuation Report for This Property
The Home Valuation Report is an in-depth analysis detailing your home's value as well as a comparison with similar homes in the area
Home Values in the Area
Average Home Value in this Area
Purchase History
| Date | Buyer | Sale Price | Title Company |
|---|---|---|---|
| Graham John O | $378,800 | -- |
Source: Public Records
Mortgage History
| Date | Status | Borrower | Loan Amount |
|---|---|---|---|
| Open | Graham John O | $227,000 | |
| Closed | Graham John O | $250,000 | |
| Previous Owner | Graham John O | $299,700 |
Source: Public Records
Tax History Compared to Growth
Tax History
| Year | Tax Paid | Tax Assessment Tax Assessment Total Assessment is a certain percentage of the fair market value that is determined by local assessors to be the total taxable value of land and additions on the property. | Land | Improvement |
|---|---|---|---|---|
| 2025 | $10,255 | $306,670 | $128,100 | $178,570 |
| 2024 | $10,255 | $306,670 | $128,100 | $178,570 |
| 2023 | $9,568 | $306,670 | $128,100 | $178,570 |
| 2022 | $9,568 | $306,670 | $128,100 | $178,570 |
| 2021 | $9,719 | $283,780 | $128,070 | $155,710 |
| 2020 | $9,665 | $282,190 | $128,080 | $154,110 |
| 2019 | $9,149 | $282,190 | $128,080 | $154,110 |
| 2018 | $9,157 | $282,190 | $128,080 | $154,110 |
| 2017 | $8,903 | $282,190 | $128,080 | $154,110 |
| 2016 | $10,763 | $341,140 | $149,940 | $191,200 |
| 2015 | $10,763 | $341,140 | $149,940 | $191,200 |
| 2014 | $10,934 | $341,140 | $149,940 | $191,200 |
Source: Public Records
Map
Nearby Homes
- 3 Stoddard Rd
- 2 Old Town Hwy Unit 39
- 166 Beach Ave
- 44 Meadow View Rd
- 280 Marion St
- 372 Cosey Beach Ave
- 119 Cove St
- 86 Cove St
- 114 Cove St
- 16 Catherine St
- 266 Cosey Beach Ave
- 262 & 264 Cosey Beach Ave
- 50 Concord St
- 75 Townsend Ave
- 77 Concord St
- 53 Cosey Beach Rd
- 384 Silver Sands Rd
- 380 Silver Sands Rd
- 60 Coleman St Unit 15
- 34 Beecher Place