Estimated Value: $132,260 - $160,000
3
Beds
1
Bath
1,056
Sq Ft
$138/Sq Ft
Est. Value
About This Home
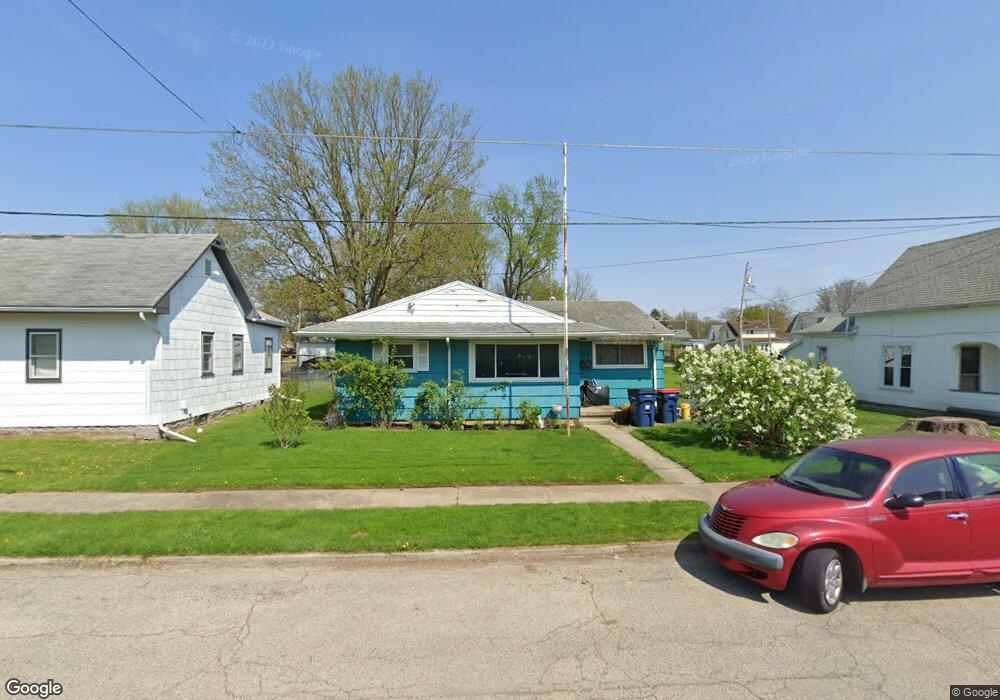
This home is located at 117 Morrow St, Piqua, OH 45356 and is currently estimated at $146,065, approximately $138 per square foot. 117 Morrow St is a home located in Miami County with nearby schools including Piqua Junior High School, Piqua High School, and Nicholas School.
Ownership History
Date
Name
Owned For
Owner Type
Purchase Details
Closed on
Apr 3, 2015
Sold by
Cornelius Beverly
Bought by
Knightly Properties Llc
Current Estimated Value
Purchase Details
Closed on
Oct 24, 1994
Sold by
Evans Joseph E
Bought by
Martin David A and Martin Serena K
Home Financials for this Owner
Home Financials are based on the most recent Mortgage that was taken out on this home.
Original Mortgage
$50,500
Interest Rate
8.53%
Mortgage Type
New Conventional
Create a Home Valuation Report for This Property
The Home Valuation Report is an in-depth analysis detailing your home's value as well as a comparison with similar homes in the area
Home Values in the Area
Average Home Value in this Area
Purchase History
| Date | Buyer | Sale Price | Title Company |
|---|---|---|---|
| Knightly Properties Llc | $100,000 | Attorney | |
| Martin David A | $48,056 | -- |
Source: Public Records
Mortgage History
| Date | Status | Borrower | Loan Amount |
|---|---|---|---|
| Previous Owner | Martin David A | $50,500 |
Source: Public Records
Tax History
| Year | Tax Paid | Tax Assessment Tax Assessment Total Assessment is a certain percentage of the fair market value that is determined by local assessors to be the total taxable value of land and additions on the property. | Land | Improvement |
|---|---|---|---|---|
| 2025 | $1,220 | $34,550 | $5,950 | $28,600 |
| 2024 | $1,220 | $25,970 | $6,650 | $19,320 |
| 2023 | $1,067 | $25,970 | $6,650 | $19,320 |
| 2022 | $1,114 | $25,970 | $6,650 | $19,320 |
| 2021 | $885 | $19,260 | $4,940 | $14,320 |
| 2020 | $885 | $19,260 | $4,940 | $14,320 |
| 2019 | $890 | $19,260 | $4,940 | $14,320 |
| 2018 | $910 | $18,770 | $4,940 | $13,830 |
| 2017 | $921 | $18,770 | $4,940 | $13,830 |
| 2016 | $912 | $18,770 | $4,940 | $13,830 |
| 2015 | $898 | $18,060 | $4,760 | $13,300 |
| 2014 | $898 | $18,060 | $4,760 | $13,300 |
| 2013 | $901 | $18,060 | $4,760 | $13,300 |
Source: Public Records
Map
Nearby Homes
- 121 Morrow St
- 115 Morrow St
- 125 Morrow St
- 1025 Covington Ave
- 1027 Covington Ave
- 1023 Covington Ave
- 126 Linden Ave
- 128 Linden Ave
- 1103 Covington Ave
- 124 Linden Ave
- 130 Linden Ave
- 1015 Covington Ave
- 124 Morrow St
- 126 Morrow St
- 131 Morrow St
- 132 Linden Ave
- 130 Morrow St
- 1105 Covington Ave
- 1013 Covington Ave
- 132 Morrow St
Your Personal Tour Guide
Ask me questions while you tour the home.