Estimated Value: $150,000 - $185,000
3
Beds
1
Bath
1,040
Sq Ft
$155/Sq Ft
Est. Value
About This Home
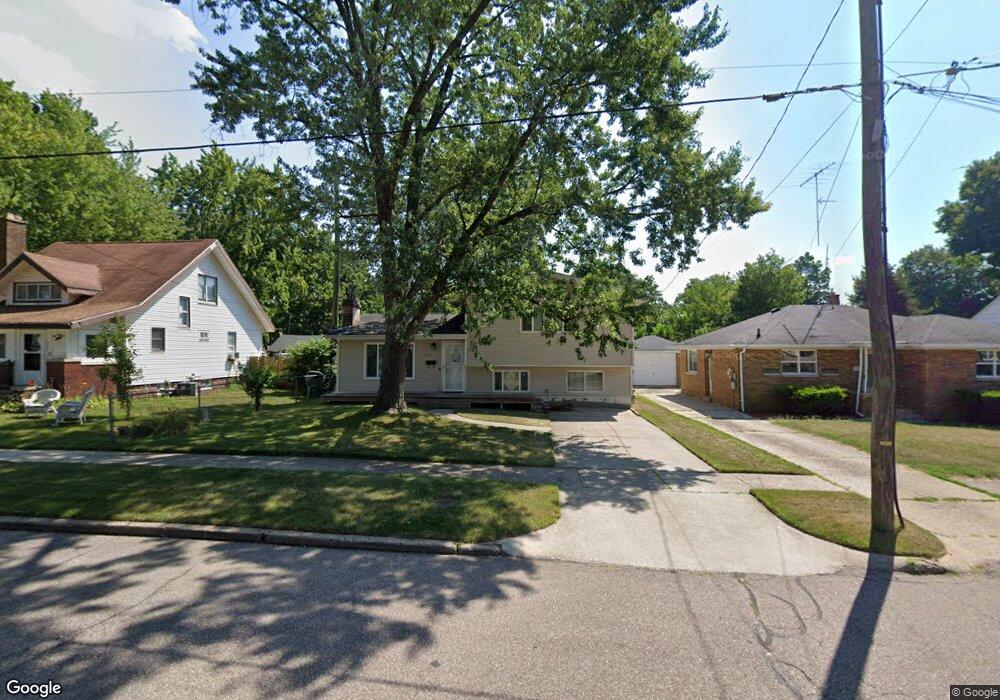
This home is located at 117 N 15th St, Niles, MI 49120 and is currently estimated at $161,111, approximately $154 per square foot. 117 N 15th St is a home located in Berrien County with nearby schools including Ballard Elementary School, Oak Manor Sixth Grade Center, and Ring Lardner Middle School.
Ownership History
Date
Name
Owned For
Owner Type
Purchase Details
Closed on
Mar 12, 2019
Sold by
Mazumder Robert
Bought by
Mazudmder Alisa Salviana
Current Estimated Value
Purchase Details
Closed on
Feb 28, 2011
Sold by
Secretary Of Housing & Urban Development
Bought by
Mazumder Albert
Home Financials for this Owner
Home Financials are based on the most recent Mortgage that was taken out on this home.
Original Mortgage
$23,000
Outstanding Balance
$1,070
Interest Rate
4.92%
Mortgage Type
New Conventional
Estimated Equity
$160,041
Purchase Details
Closed on
Sep 14, 2010
Sold by
Citimortgage Inc
Bought by
The Secretary Of Housing & Urban Develop
Purchase Details
Closed on
Mar 11, 2010
Sold by
Butterworth Jeffery A and Butterworth Robin M
Bought by
Citimortgage Inc
Purchase Details
Closed on
Oct 22, 1991
Purchase Details
Closed on
Jun 16, 1987
Purchase Details
Closed on
Sep 3, 1985
Create a Home Valuation Report for This Property
The Home Valuation Report is an in-depth analysis detailing your home's value as well as a comparison with similar homes in the area
Home Values in the Area
Average Home Value in this Area
Purchase History
| Date | Buyer | Sale Price | Title Company |
|---|---|---|---|
| Mazudmder Alisa Salviana | -- | None Available | |
| Mazumder Albert | $32,400 | Cti | |
| The Secretary Of Housing & Urban Develop | -- | None Available | |
| Citimortgage Inc | $33,307 | None Available | |
| -- | $44,500 | -- | |
| -- | $35,900 | -- | |
| -- | $27,000 | -- |
Source: Public Records
Mortgage History
| Date | Status | Borrower | Loan Amount |
|---|---|---|---|
| Open | Mazumder Albert | $23,000 |
Source: Public Records
Tax History Compared to Growth
Tax History
| Year | Tax Paid | Tax Assessment Tax Assessment Total Assessment is a certain percentage of the fair market value that is determined by local assessors to be the total taxable value of land and additions on the property. | Land | Improvement |
|---|---|---|---|---|
| 2025 | $1,236 | $63,300 | $0 | $0 |
| 2024 | $965 | $49,600 | $0 | $0 |
| 2023 | $925 | $42,100 | $0 | $0 |
| 2022 | $881 | $32,800 | $0 | $0 |
| 2021 | $1,085 | $30,500 | $2,300 | $28,200 |
| 2020 | $1,073 | $29,100 | $0 | $0 |
| 2019 | $1,060 | $26,900 | $1,600 | $25,300 |
| 2018 | $1,043 | $26,900 | $0 | $0 |
| 2017 | $1,103 | $33,000 | $0 | $0 |
| 2016 | $1,079 | $30,900 | $0 | $0 |
| 2015 | $1,076 | $29,900 | $0 | $0 |
| 2014 | $839 | $28,100 | $0 | $0 |
Source: Public Records
Map
Nearby Homes