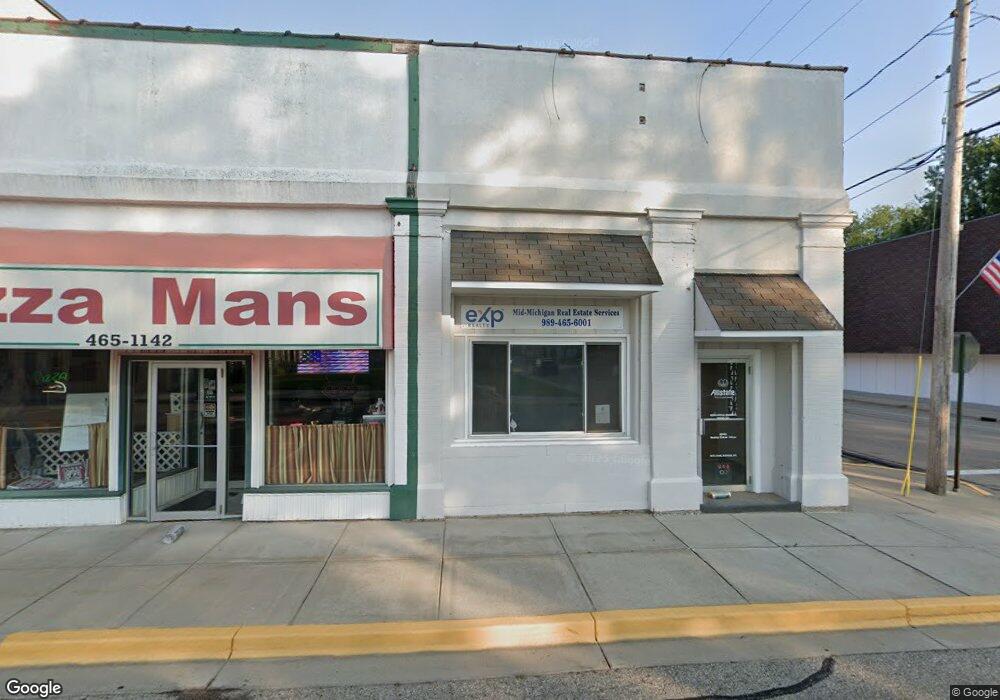
117 N 4th St Coleman, MI 48618
Estimated Value: $56,861 - $148,000
2
Beds
1
Bath
675
Sq Ft
$133/Sq Ft
Est. Value
About This Home
This home is located at 117 N 4th St, Coleman, MI 48618 and is currently estimated at $89,954, approximately $133 per square foot. 117 N 4th St is a home located in Midland County with nearby schools including Coleman Elementary School and Coleman Junior/Senior High School.
Ownership History
Date
Name
Owned For
Owner Type
Purchase Details
Closed on
May 16, 2023
Sold by
Livin Leon and Livin Barbara
Bought by
Klein Robert
Current Estimated Value
Home Financials for this Owner
Home Financials are based on the most recent Mortgage that was taken out on this home.
Original Mortgage
$40,740
Outstanding Balance
$39,584
Interest Rate
6.28%
Mortgage Type
New Conventional
Estimated Equity
$50,370
Purchase Details
Closed on
Sep 12, 2017
Sold by
Andrews Barbara J
Bought by
Andrews Leon L and Andrews Barbara J
Purchase Details
Closed on
Sep 14, 2011
Sold by
Fifth Third Bank
Bought by
Andrews Barbara J *Trust*
Purchase Details
Closed on
Mar 5, 2011
Sold by
Ward Michael D
Bought by
Fifth Third Bank
Purchase Details
Closed on
Oct 29, 2002
Sold by
Union Federal Bank Of Indianapolis
Bought by
Ward Michael D
Purchase Details
Closed on
Dec 4, 2001
Sold by
Staley Robert and Staley Cathy
Bought by
Union Federal Bank Of Indianapolis
Purchase Details
Closed on
Jul 10, 1996
Create a Home Valuation Report for This Property
The Home Valuation Report is an in-depth analysis detailing your home's value as well as a comparison with similar homes in the area
Home Values in the Area
Average Home Value in this Area
Purchase History
| Date | Buyer | Sale Price | Title Company |
|---|---|---|---|
| Klein Robert | $42,000 | None Listed On Document | |
| Klein Robert | $42,000 | None Listed On Document | |
| Andrews Leon L | -- | None Available | |
| Andrews Barbara J *Trust* | $19,000 | -- | |
| Fifth Third Bank | $21,000 | -- | |
| Ward Michael D | $27,500 | -- | |
| Union Federal Bank Of Indianapolis | $37,000 | -- | |
| -- | $35,000 | -- |
Source: Public Records
Mortgage History
| Date | Status | Borrower | Loan Amount |
|---|---|---|---|
| Open | Klein Robert | $40,740 | |
| Closed | Klein Robert | $40,740 |
Source: Public Records
Tax History Compared to Growth
Tax History
| Year | Tax Paid | Tax Assessment Tax Assessment Total Assessment is a certain percentage of the fair market value that is determined by local assessors to be the total taxable value of land and additions on the property. | Land | Improvement |
|---|---|---|---|---|
| 2025 | $1,371 | $23,400 | $0 | $0 |
| 2024 | $677 | $22,300 | $0 | $0 |
| 2023 | $435 | $22,700 | $0 | $0 |
| 2022 | $832 | $21,000 | $0 | $0 |
| 2021 | $800 | $18,400 | $0 | $0 |
| 2020 | $796 | $16,400 | $0 | $0 |
| 2019 | $777 | $12,100 | $0 | $0 |
| 2018 | $762 | $12,100 | $12,100 | $0 |
| 2017 | $0 | $12,600 | $12,600 | $0 |
| 2016 | $800 | $12,800 | $12,800 | $0 |
| 2014 | -- | $14,300 | $14,300 | $0 |
Source: Public Records
Map
Nearby Homes
- 306 E Webster St
- 338 Jackson St
- 305 N 7th St
- 206 W Railway St
- 400 Mill St
- 0 Simons Unit 50163791
- 5239 N Coleman Rd
- TBD Murphy St
- 4832 N Dickenson Rd
- 4535 N Corey Ln
- 5883 W Fike Rd
- 1950 E Alamando Roads
- 0 V L Ne County Line Rd Unit LotWP001
- 11421 E Pere Marquette Rd
- 5495 W Burns Rd
- 8753 N Chippewa Rd
- 4262 W Fike Rd
- 9996 N Chippewa Rd
- 8410 N Wise Rd
- 6744 N Coleman Rd
- 115 4th St
- 111 S 4th St
- 201 N 4th St
- 105 N Fourth
- 105 N 4th St
- 108 N 4th St
- 310 E Washington St
- 219 E Railway St
- 213 E Railway St
- 231 E Railway St
- 305 E Railway St
- 203 E Washington St
- 208 E Adams St
- 211 4th St
- 209 E Railway St
- 207 E Railway St
- 110 N 5th St
- 307 E Railway St
- 206 E Adams St
- 302 E Adams St