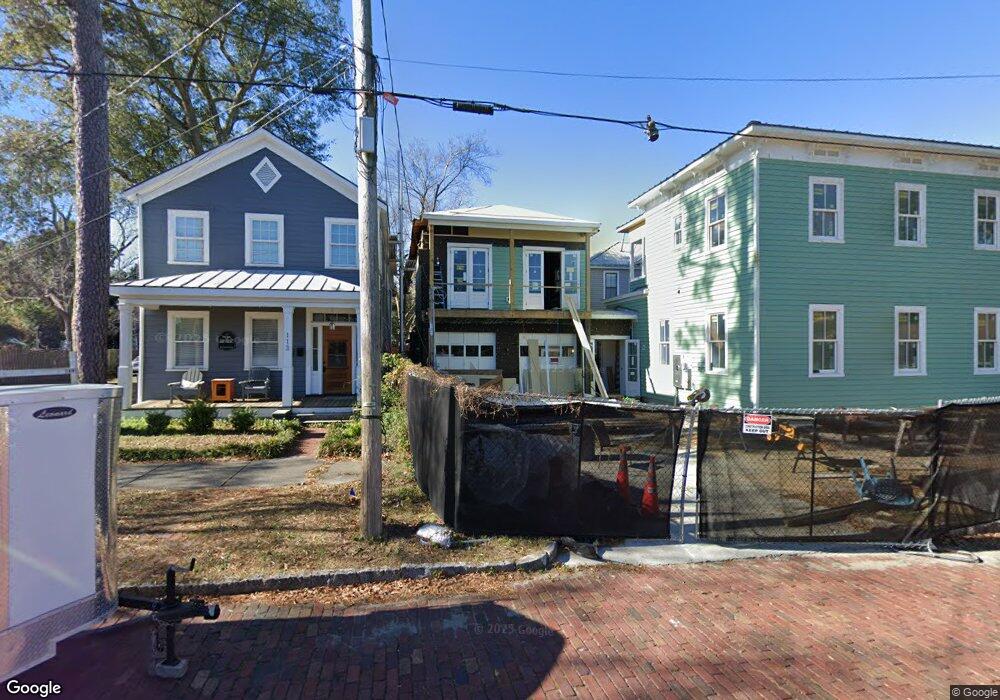
117 N 7th St Wilmington, NC 28401
Hemenway NeighborhoodEstimated Value: $586,628 - $608,000
1
Bed
1
Bath
2,276
Sq Ft
$261/Sq Ft
Est. Value
About This Home
This home is located at 117 N 7th St, Wilmington, NC 28401 and is currently estimated at $594,907, approximately $261 per square foot. 117 N 7th St is a home located in New Hanover County with nearby schools including Snipes Academy of Arts & Design, Williston Middle School, and New Hanover High School.
Ownership History
Date
Name
Owned For
Owner Type
Purchase Details
Closed on
Nov 8, 2023
Sold by
Hembise Marc R De Maleingreau and Hembise Isabelle
Bought by
Tornes Kevin and Stockstill-Tornes Taber
Current Estimated Value
Home Financials for this Owner
Home Financials are based on the most recent Mortgage that was taken out on this home.
Original Mortgage
$370,120
Outstanding Balance
$363,099
Interest Rate
7.31%
Mortgage Type
New Conventional
Estimated Equity
$231,808
Purchase Details
Closed on
Sep 27, 2019
Sold by
Baxter Molly
Bought by
Demaleingreau Marc
Purchase Details
Closed on
Nov 2, 2006
Sold by
Fox Ben R and Fox Jane M
Bought by
Baxter Molly
Home Financials for this Owner
Home Financials are based on the most recent Mortgage that was taken out on this home.
Original Mortgage
$248,000
Interest Rate
6.12%
Mortgage Type
Purchase Money Mortgage
Purchase Details
Closed on
Feb 17, 2005
Sold by
Stoneham H Bryant
Bought by
Fox Ben R and Fox Jane M
Home Financials for this Owner
Home Financials are based on the most recent Mortgage that was taken out on this home.
Original Mortgage
$156,000
Interest Rate
5.61%
Mortgage Type
Purchase Money Mortgage
Purchase Details
Closed on
Feb 27, 1998
Sold by
Flaugher Steven M
Bought by
Stoneham H Bryant
Purchase Details
Closed on
Apr 26, 1993
Sold by
Martin Douglas J
Bought by
Flaugher Steven M
Purchase Details
Closed on
Jun 1, 1988
Sold by
Epstein Mathias
Bought by
Martin Douglas J
Purchase Details
Closed on
Sep 1, 1985
Sold by
Katsaros Argie Leon Mavrola
Bought by
Epstein Mathias
Purchase Details
Closed on
Aug 1, 1961
Bought by
Katsaros Argie Leon Mavrola
Create a Home Valuation Report for This Property
The Home Valuation Report is an in-depth analysis detailing your home's value as well as a comparison with similar homes in the area
Home Values in the Area
Average Home Value in this Area
Purchase History
| Date | Buyer | Sale Price | Title Company |
|---|---|---|---|
| Tornes Kevin | $487,000 | None Listed On Document | |
| Tornes Kevin | $487,000 | None Listed On Document | |
| Demaleingreau Marc | $255,000 | None Available | |
| Demaleingreau Marc | $255,000 | None Available | |
| Baxter Molly | $310,000 | None Available | |
| Baxter Molly | $310,000 | None Available | |
| Fox Ben R | $195,000 | None Available | |
| Fox Ben R | $195,000 | None Available | |
| Stoneham H Bryant | $165,000 | -- | |
| Stoneham H Bryant | $165,000 | -- | |
| Flaugher Steven M | $74,000 | -- | |
| Flaugher Steven M | $74,000 | -- | |
| Martin Douglas J | $66,000 | -- | |
| Martin Douglas J | $66,000 | -- | |
| Epstein Mathias | $9,000 | -- | |
| Epstein Mathias | $9,000 | -- | |
| Katsaros Argie Leon Mavrola | -- | -- | |
| Katsaros Argie Leon Mavrola | -- | -- |
Source: Public Records
Mortgage History
| Date | Status | Borrower | Loan Amount |
|---|---|---|---|
| Open | Tornes Kevin | $370,120 | |
| Previous Owner | Baxter Molly | $248,000 | |
| Previous Owner | Fox Ben R | $156,000 |
Source: Public Records
Tax History Compared to Growth
Tax History
| Year | Tax Paid | Tax Assessment Tax Assessment Total Assessment is a certain percentage of the fair market value that is determined by local assessors to be the total taxable value of land and additions on the property. | Land | Improvement |
|---|---|---|---|---|
| 2025 | -- | $452,600 | $94,800 | $357,800 |
| 2024 | -- | $337,600 | $72,000 | $265,600 |
| 2023 | $2,853 | $337,600 | $72,000 | $265,600 |
| 2022 | $2,889 | $337,600 | $72,000 | $265,600 |
| 2021 | $2,889 | $337,600 | $72,000 | $265,600 |
| 2020 | $2,924 | $277,600 | $67,600 | $210,000 |
| 2019 | $2,924 | $277,600 | $67,600 | $210,000 |
| 2018 | $2,924 | $277,600 | $67,600 | $210,000 |
| 2017 | $2,924 | $277,600 | $67,600 | $210,000 |
| 2016 | $2,392 | $215,900 | $76,600 | $139,300 |
| 2015 | $2,286 | $215,900 | $76,600 | $139,300 |
| 2014 | $2,189 | $215,900 | $76,600 | $139,300 |
Source: Public Records
Map
Nearby Homes