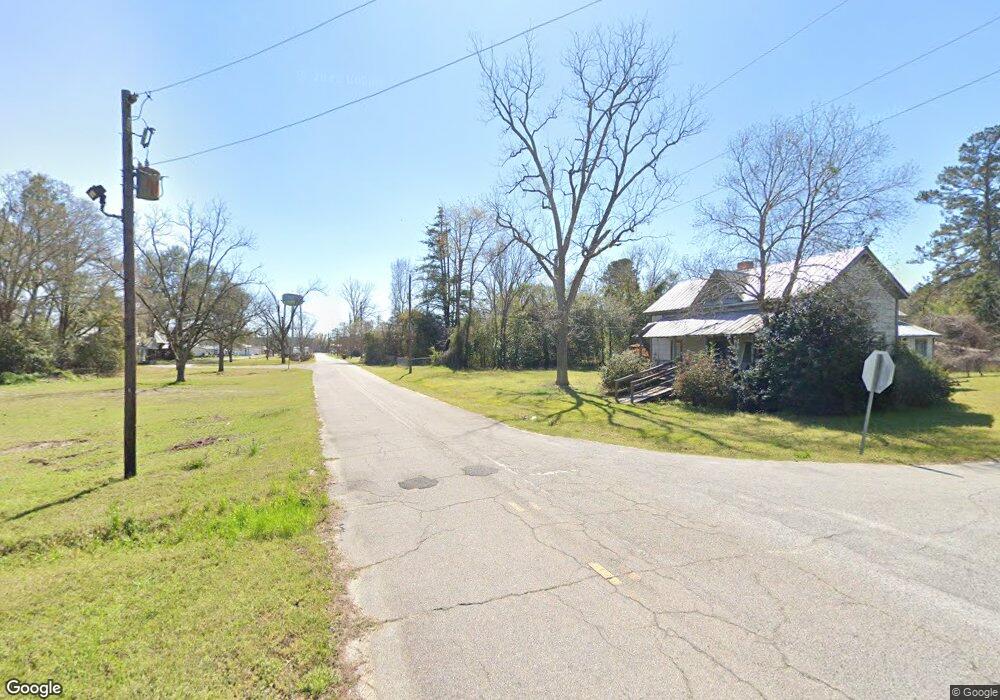
117 N Railroad Ave Garfield, GA 30425
Estimated Value: $123,674 - $170,000
2
Beds
2
Baths
1,632
Sq Ft
$90/Sq Ft
Est. Value
About This Home
This home is located at 117 N Railroad Ave, Garfield, GA 30425 and is currently estimated at $146,891, approximately $90 per square foot. 117 N Railroad Ave is a home located in Emanuel County with nearby schools including Twin City Elementary School.
Ownership History
Date
Name
Owned For
Owner Type
Purchase Details
Closed on
Nov 6, 2020
Sold by
Sconyers Julian H
Bought by
Daw Bobby W and Jarrell Angela N
Current Estimated Value
Home Financials for this Owner
Home Financials are based on the most recent Mortgage that was taken out on this home.
Original Mortgage
$17,500
Interest Rate
2.8%
Mortgage Type
New Conventional
Purchase Details
Closed on
Oct 29, 2012
Sold by
Tapley Danny R
Bought by
Sconyers Julian H
Purchase Details
Closed on
Oct 28, 2011
Sold by
The Bank Of New York Mellon
Bought by
Tapley Danny R
Purchase Details
Closed on
May 3, 2011
Sold by
Atkinson Jill M and Lash Atkinson B
Bought by
The Bank Of New York Mellon and The Bank Of New York
Purchase Details
Closed on
May 8, 2007
Sold by
Atkinson B Lash
Bought by
Atkinson Jill M
Purchase Details
Closed on
Jun 14, 2001
Sold by
Atkinson Lawrence A
Bought by
Atkinson Lash B
Purchase Details
Closed on
Dec 14, 2000
Sold by
Campbell Donna Jo
Bought by
Atkinson Lawrence A
Create a Home Valuation Report for This Property
The Home Valuation Report is an in-depth analysis detailing your home's value as well as a comparison with similar homes in the area
Home Values in the Area
Average Home Value in this Area
Purchase History
| Date | Buyer | Sale Price | Title Company |
|---|---|---|---|
| Daw Bobby W | $20,000 | -- | |
| Tapley Julie Y | -- | -- | |
| Sconyers Julian H | $24,900 | -- | |
| Tapley Danny R | $24,900 | -- | |
| The Bank Of New York Mellon | $36,000 | -- | |
| Atkinson Jill M | -- | -- | |
| Atkinson Lash B | -- | -- | |
| Atkinson Lawrence A | $17,500 | -- |
Source: Public Records
Mortgage History
| Date | Status | Borrower | Loan Amount |
|---|---|---|---|
| Closed | Tapley Julie Y | $17,500 |
Source: Public Records
Tax History Compared to Growth
Tax History
| Year | Tax Paid | Tax Assessment Tax Assessment Total Assessment is a certain percentage of the fair market value that is determined by local assessors to be the total taxable value of land and additions on the property. | Land | Improvement |
|---|---|---|---|---|
| 2024 | $1,456 | $42,715 | $672 | $42,043 |
| 2023 | $599 | $39,554 | $672 | $38,882 |
| 2022 | $955 | $36,122 | $672 | $35,450 |
| 2021 | $917 | $34,106 | $768 | $33,338 |
| 2020 | $778 | $25,631 | $801 | $24,830 |
| 2019 | $774 | $25,631 | $801 | $24,830 |
| 2018 | $735 | $25,560 | $801 | $24,759 |
| 2017 | $690 | $23,943 | $801 | $23,142 |
| 2016 | $690 | $23,943 | $801 | $23,142 |
| 2015 | -- | $24,093 | $950 | $23,142 |
| 2014 | -- | $21,468 | $760 | $20,708 |
| 2013 | -- | $21,356 | $760 | $20,595 |
Source: Public Records
Map
Nearby Homes
- 405 Monroe St
- 211 S Railroad St
- 410 L B Hall Rd
- 0 Mount Zion Church Rd
- 889 Ga Highway 192 N
- 000 Scuffletown Rd
- 519 Wilson Rd
- 4926 Gillespie Rd Unit 3
- 2.11 ACRES Gillespie Rd Unit 1
- 2.85 ACRES Gillespie Rd Unit 2
- 2.73 ACRES Gillespie Rd Unit 4
- 317 5th Ave
- 912 5th Ave
- 211 6th Ave
- 0 Bowen Hill Rd
- 5524 Hooker Branch Rd
- 1120 5th Ave
- 5420 Martin Rd S
- 0 Scarboro Church Rd Unit 25066343
- 0 Thomas Rd Unit 163088
- 121 N Railroad Ave
- 0 Sybil St
- 201 N Railroad Ave
- 107 N Railroad Ave
- 204 Sybil St
- 114 N Railroad Ave
- 202 S Railroad Ave
- 205 N Railroad Ave
- 203 Sybil St
- 201 Sybil St
- 207 Main St
- 123 Green St
- 201 Greene St
- 118 N Railroad Ave
- 212 Greene St
- 212 E Monroe St
- 115 Monroe St
- 436 Monroe St
- 1 Monroe St
- 0 Monroe St Unit 9050795