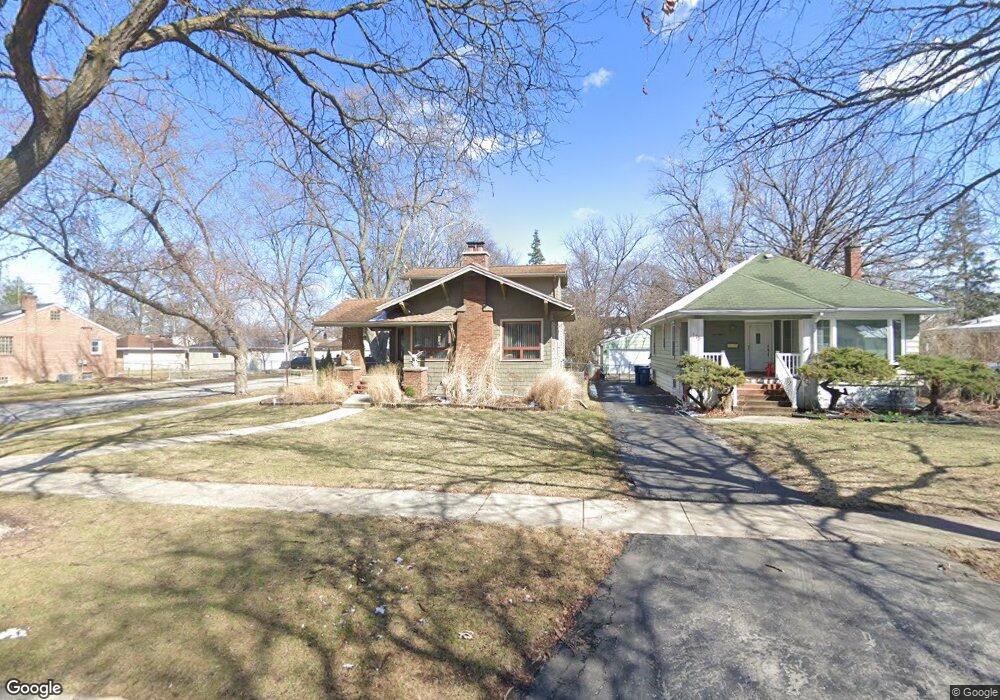
117 N Yale Ave Villa Park, IL 60181
Estimated Value: $389,000 - $441,000
3
Beds
2
Baths
1,695
Sq Ft
$242/Sq Ft
Est. Value
About This Home
This home is located at 117 N Yale Ave, Villa Park, IL 60181 and is currently estimated at $409,455, approximately $241 per square foot. 117 N Yale Ave is a home located in DuPage County with nearby schools including North Elementary School, Jefferson Middle School, and Willowbrook High School.
Ownership History
Date
Name
Owned For
Owner Type
Purchase Details
Closed on
Dec 7, 2017
Sold by
Laible Philip D
Bought by
Labuz Marcin and Labuz Sylwia A
Current Estimated Value
Home Financials for this Owner
Home Financials are based on the most recent Mortgage that was taken out on this home.
Original Mortgage
$264,616
Outstanding Balance
$222,784
Interest Rate
3.94%
Mortgage Type
New Conventional
Estimated Equity
$186,671
Purchase Details
Closed on
Jan 10, 2000
Sold by
Laible Heather W
Bought by
Laible Philip D
Purchase Details
Closed on
Jul 28, 1995
Sold by
Freiny Donald L and Freiny Barbara J
Bought by
Laible Philip D and Laible Heather W
Home Financials for this Owner
Home Financials are based on the most recent Mortgage that was taken out on this home.
Original Mortgage
$142,975
Interest Rate
7.56%
Create a Home Valuation Report for This Property
The Home Valuation Report is an in-depth analysis detailing your home's value as well as a comparison with similar homes in the area
Home Values in the Area
Average Home Value in this Area
Purchase History
| Date | Buyer | Sale Price | Title Company |
|---|---|---|---|
| Labuz Marcin | -- | Chicago Title Insurance Comp | |
| Laible Philip D | -- | -- | |
| Laible Philip D | $150,500 | -- |
Source: Public Records
Mortgage History
| Date | Status | Borrower | Loan Amount |
|---|---|---|---|
| Open | Labuz Marcin | $264,616 | |
| Previous Owner | Laible Philip D | $142,975 |
Source: Public Records
Tax History Compared to Growth
Tax History
| Year | Tax Paid | Tax Assessment Tax Assessment Total Assessment is a certain percentage of the fair market value that is determined by local assessors to be the total taxable value of land and additions on the property. | Land | Improvement |
|---|---|---|---|---|
| 2024 | $7,952 | $113,212 | $16,297 | $96,915 |
| 2023 | $7,571 | $104,690 | $15,070 | $89,620 |
| 2022 | $7,358 | $100,630 | $14,480 | $86,150 |
| 2021 | $7,058 | $98,130 | $14,120 | $84,010 |
| 2020 | $6,890 | $95,980 | $13,810 | $82,170 |
| 2019 | $6,431 | $91,250 | $13,130 | $78,120 |
| 2018 | $6,126 | $82,270 | $11,840 | $70,430 |
| 2017 | $5,977 | $78,390 | $11,280 | $67,110 |
| 2016 | $5,806 | $73,850 | $10,630 | $63,220 |
| 2015 | $5,721 | $68,800 | $9,900 | $58,900 |
| 2014 | $5,051 | $61,660 | $15,950 | $45,710 |
| 2013 | $4,814 | $62,520 | $16,170 | $46,350 |
Source: Public Records
Map
Nearby Homes
- 235 N Ardmore Ave
- 247 N Ardmore Ave
- 58 E Division St
- 37 N Addison Rd
- 439 N Harvard Ave
- 417 W Terrace St
- 114 E Kenilworth Ave
- 1136 E Kenilworth Ave
- 117 E Vermont St
- 490 N Chatham Ave
- 935 E Saint Charles Rd
- 169 S Villa Ave
- 912 E Saint Charles Rd
- 700 W Pleasant St
- 17W517 Manor Ln
- 131 N Chase Ave
- 194 Washington St
- 736 E Saint Charles Rd
- 316 E Highland Ave
- 204 E Hill St
- 115 N Yale Ave
- 203 N Yale Ave
- 113 N Yale Ave
- 207 N Yale Ave
- 109 N Yale Ave
- 124 N Princeton Ave
- 105 N Yale Ave
- 211 N Yale Ave
- 114 N Princeton Ave
- 122 N Yale Ave
- 202 N Princeton Ave
- 101 N Yale Ave
- 108 N Princeton Ave
- 120 N Princeton Ave
- 206 N Princeton Ave
- 114 N Yale Ave
- 213 N Yale Ave
- 118 N Yale Ave
- 212 N Princeton Ave
- 104 N Princeton Ave