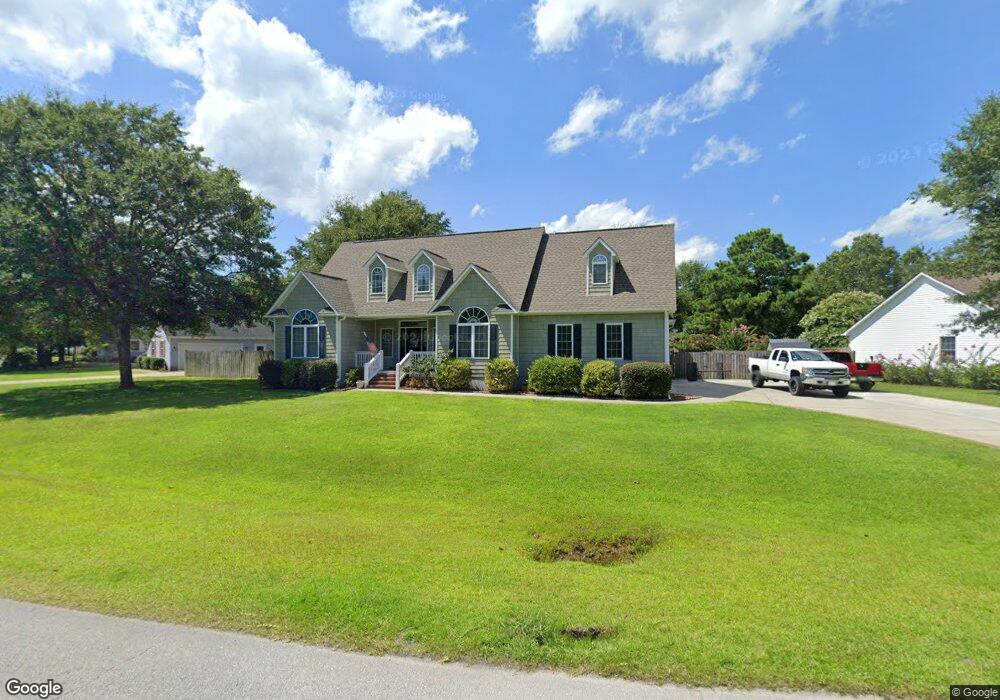
117 Nine J Dr Newport, NC 28570
Estimated Value: $414,000 - $476,000
3
Beds
2
Baths
2,539
Sq Ft
$173/Sq Ft
Est. Value
About This Home
This home is located at 117 Nine J Dr, Newport, NC 28570 and is currently estimated at $439,280, approximately $173 per square foot. 117 Nine J Dr is a home located in Carteret County with nearby schools including Newport Elementary School, Newport Middle School, and West Carteret High School.
Ownership History
Date
Name
Owned For
Owner Type
Purchase Details
Closed on
Dec 15, 2008
Sold by
Federal National Mortgage Association
Bought by
Duncan Erica R
Current Estimated Value
Purchase Details
Closed on
Aug 11, 2008
Sold by
Bennett Daren and Wachovia Mortgage Corp
Bought by
Federal National Mortgage Association
Purchase Details
Closed on
Jun 13, 2006
Sold by
Stockman Dean L and Stockman Susan
Bought by
Bennett Daren
Home Financials for this Owner
Home Financials are based on the most recent Mortgage that was taken out on this home.
Original Mortgage
$254,000
Interest Rate
6.5%
Mortgage Type
Purchase Money Mortgage
Purchase Details
Closed on
Aug 31, 2005
Sold by
Corbett Roger D and Corbett Angela A
Bought by
Stockman Dean L and Stockman Susan
Home Financials for this Owner
Home Financials are based on the most recent Mortgage that was taken out on this home.
Original Mortgage
$181,000
Interest Rate
7.37%
Mortgage Type
Purchase Money Mortgage
Purchase Details
Closed on
Aug 11, 2004
Create a Home Valuation Report for This Property
The Home Valuation Report is an in-depth analysis detailing your home's value as well as a comparison with similar homes in the area
Home Values in the Area
Average Home Value in this Area
Purchase History
| Date | Buyer | Sale Price | Title Company |
|---|---|---|---|
| Duncan Erica R | -- | None Available | |
| Federal National Mortgage Association | $269,090 | None Available | |
| Bennett Daren | $254,000 | None Available | |
| Stockman Dean L | $229,000 | None Available | |
| -- | -- | -- |
Source: Public Records
Mortgage History
| Date | Status | Borrower | Loan Amount |
|---|---|---|---|
| Previous Owner | Bennett Daren | $254,000 | |
| Previous Owner | Stockman Dean L | $181,000 |
Source: Public Records
Tax History Compared to Growth
Tax History
| Year | Tax Paid | Tax Assessment Tax Assessment Total Assessment is a certain percentage of the fair market value that is determined by local assessors to be the total taxable value of land and additions on the property. | Land | Improvement |
|---|---|---|---|---|
| 2025 | $1,376 | $387,306 | $60,746 | $326,560 |
| 2024 | $1,338 | $258,388 | $45,383 | $213,005 |
| 2023 | $1,361 | $258,388 | $45,383 | $213,005 |
| 2022 | $1,335 | $258,388 | $45,383 | $213,005 |
| 2021 | $642 | $258,388 | $45,383 | $213,005 |
| 2020 | $1,291 | $258,388 | $45,383 | $213,005 |
| 2019 | $1,242 | $265,523 | $45,383 | $220,140 |
| 2017 | $1,164 | $259,040 | $38,900 | $220,140 |
| 2016 | $1,164 | $259,040 | $38,900 | $220,140 |
| 2015 | $1,138 | $259,040 | $38,900 | $220,140 |
| 2014 | -- | $262,828 | $36,957 | $225,871 |
Source: Public Records
Map
Nearby Homes
- 105 D Lee Place
- 861 Roberts Rd
- 190 Cedar Creek Rd
- 117 Duncan Ln
- 402 Crestwood Dr
- 180 Mills Rd
- 101 Ole Field Cir Unit E
- 202 Jessica
- 105 Tar Kiln Ln
- 119 Canal St
- 115 Countryside Ct
- 808 Discovery Cove
- 810 Discovery Cove
- 506 Cove Dr
- 504 Cove Dr
- The Villas Plan at The Villas
- 805 Discovery Cove
- 307 Sweetwater Cove
- 119 Tradition Trail
- 191 Gray Squirrel Ln