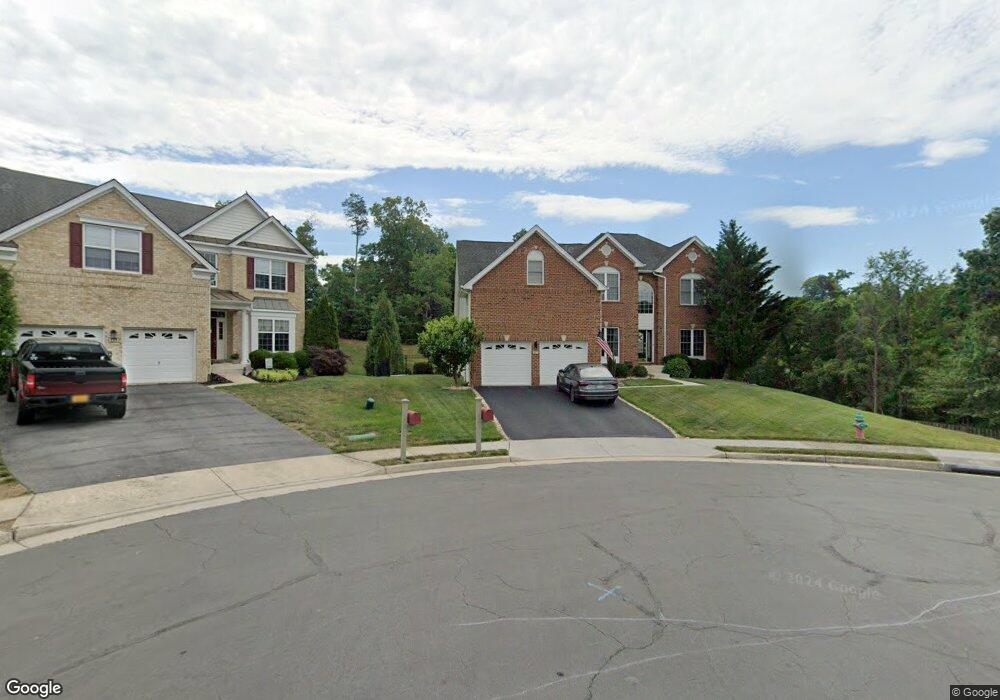
117 Pangborne Ct Winchester, VA 22602
Estimated Value: $682,000 - $708,930
4
Beds
5
Baths
3,537
Sq Ft
$196/Sq Ft
Est. Value
About This Home
This home is located at 117 Pangborne Ct, Winchester, VA 22602 and is currently estimated at $693,483, approximately $196 per square foot. 117 Pangborne Ct is a home located in Frederick County with nearby schools including Admiral Richard E. Byrd Middle School, Millbrook High School, and Sharon's Centre.
Ownership History
Date
Name
Owned For
Owner Type
Purchase Details
Closed on
Mar 2, 2007
Sold by
Toll Va Iv
Bought by
Chandler Ii Samuel M and Chandler Ii,Janice
Current Estimated Value
Home Financials for this Owner
Home Financials are based on the most recent Mortgage that was taken out on this home.
Original Mortgage
$417,000
Outstanding Balance
$252,956
Interest Rate
6.3%
Mortgage Type
New Conventional
Estimated Equity
$440,527
Create a Home Valuation Report for This Property
The Home Valuation Report is an in-depth analysis detailing your home's value as well as a comparison with similar homes in the area
Home Values in the Area
Average Home Value in this Area
Purchase History
| Date | Buyer | Sale Price | Title Company |
|---|---|---|---|
| Chandler Ii Samuel M | $622,000 | -- |
Source: Public Records
Mortgage History
| Date | Status | Borrower | Loan Amount |
|---|---|---|---|
| Open | Chandler Ii Samuel M | $417,000 |
Source: Public Records
Tax History Compared to Growth
Tax History
| Year | Tax Paid | Tax Assessment Tax Assessment Total Assessment is a certain percentage of the fair market value that is determined by local assessors to be the total taxable value of land and additions on the property. | Land | Improvement |
|---|---|---|---|---|
| 2025 | $3,623 | $754,825 | $103,000 | $651,825 |
| 2024 | $1,719 | $674,300 | $87,000 | $587,300 |
| 2023 | $3,439 | $674,300 | $87,000 | $587,300 |
| 2022 | $3,267 | $535,600 | $82,000 | $453,600 |
| 2021 | $3,267 | $535,600 | $82,000 | $453,600 |
| 2020 | $2,825 | $463,100 | $82,000 | $381,100 |
| 2019 | $2,825 | $463,100 | $82,000 | $381,100 |
| 2018 | $2,684 | $440,000 | $82,000 | $358,000 |
| 2017 | $2,640 | $440,000 | $82,000 | $358,000 |
| 2016 | $2,587 | $431,100 | $74,500 | $356,600 |
| 2015 | $2,414 | $431,100 | $74,500 | $356,600 |
| 2014 | $1,202 | $418,100 | $74,500 | $343,600 |
Source: Public Records
Map
Nearby Homes
- 104 Heath Ct
- 104 Primrose Place
- 113 Whipp Dr
- 125 Cheshire Ct
- 102 Coralyrose Ct
- 180 Munsee Cir
- 176 Munsee Cir
- 154 Solara Dr
- 174 Munsee Cir
- 216 Munsee Cir
- 226 Munsee Cir
- 228 Munsee Cir
- 253 Rossmann Blvd
- 230 Munsee Cir
- 100 Maury Way
- 100 Manasquan Way
- 201 Cobble Stone Dr
- 102 Hopi Place
- 111 Mascouten St
- 113 Mascouten St