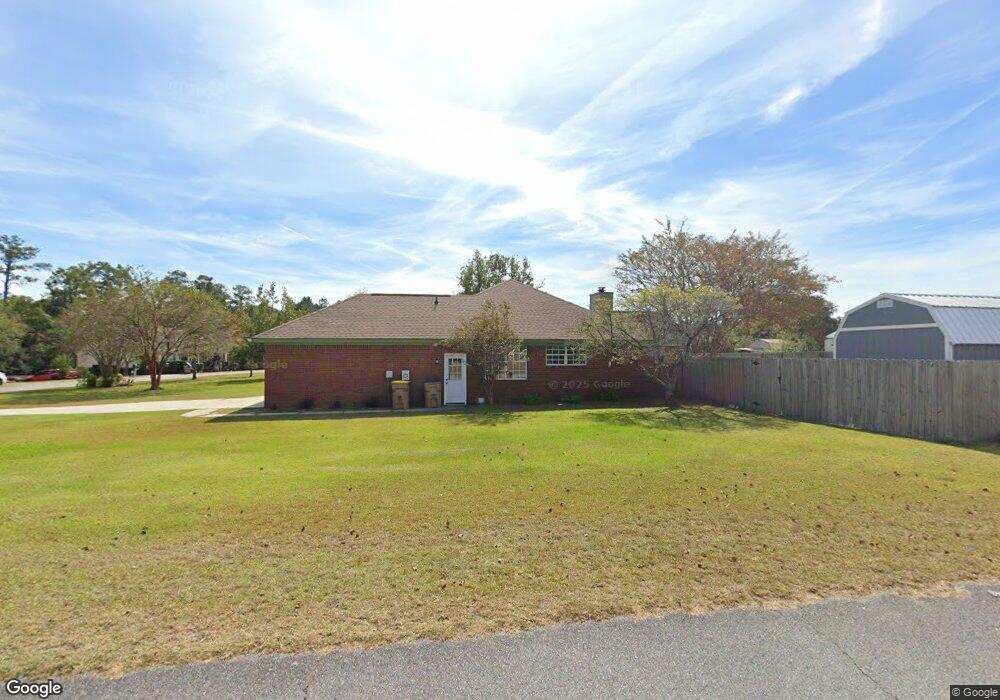
117 Partridge Run Rincon, GA 31326
Estimated Value: $356,731 - $417,000
4
Beds
2
Baths
1,950
Sq Ft
$206/Sq Ft
Est. Value
About This Home
This home is located at 117 Partridge Run, Rincon, GA 31326 and is currently estimated at $400,933, approximately $205 per square foot. 117 Partridge Run is a home located in Effingham County with nearby schools including South Effingham Elementary School, South Effingham Middle School, and South Effingham High School.
Ownership History
Date
Name
Owned For
Owner Type
Purchase Details
Closed on
Nov 27, 2019
Sold by
Holbrook Jonathan D
Bought by
Brett Benjamin Anthony
Current Estimated Value
Home Financials for this Owner
Home Financials are based on the most recent Mortgage that was taken out on this home.
Original Mortgage
$223,725
Outstanding Balance
$194,800
Interest Rate
3.7%
Mortgage Type
New Conventional
Estimated Equity
$206,133
Purchase Details
Closed on
Oct 26, 2015
Sold by
Giles Roger G
Bought by
Holbrook Jonathan D
Home Financials for this Owner
Home Financials are based on the most recent Mortgage that was taken out on this home.
Original Mortgage
$201,286
Interest Rate
4.12%
Mortgage Type
FHA
Purchase Details
Closed on
Jul 31, 1997
Bought by
Giles Roger G and Giles Lori S
Create a Home Valuation Report for This Property
The Home Valuation Report is an in-depth analysis detailing your home's value as well as a comparison with similar homes in the area
Home Values in the Area
Average Home Value in this Area
Purchase History
We collect this data history from publicly available records. To have your information removed, we recommend requesting removal directly through your county’s website.
| Date | Buyer | Sale Price | Title Company |
|---|---|---|---|
| Brett Benjamin Anthony | $235,500 | -- | |
| Holbrook Jonathan D | $205,000 | -- | |
| Giles Roger G | $132,900 | -- |
Source: Public Records
Mortgage History
We collect this data history from publicly available records. To have your information removed, we recommend requesting removal directly through your county’s website.
| Date | Status | Borrower | Loan Amount |
|---|---|---|---|
| Open | Brett Benjamin Anthony | $223,725 | |
| Previous Owner | Holbrook Jonathan D | $201,286 |
Source: Public Records
Tax History
| Year | Tax Paid | Tax Assessment Tax Assessment Total Assessment is a certain percentage of the fair market value that is determined by local assessors to be the total taxable value of land and additions on the property. | Land | Improvement |
|---|---|---|---|---|
| 2025 | $3,254 | $126,984 | $30,000 | $96,984 |
| 2024 | $3,254 | $123,704 | $26,000 | $97,704 |
| 2023 | $2,501 | $133,534 | $20,800 | $112,734 |
| 2022 | $3,024 | $104,053 | $20,000 | $84,053 |
| 2021 | $2,956 | $93,404 | $20,000 | $73,404 |
| 2020 | $2,739 | $86,756 | $18,000 | $68,756 |
| 2019 | $2,652 | $80,334 | $18,000 | $62,334 |
| 2018 | $2,547 | $75,654 | $18,000 | $57,654 |
| 2017 | $2,569 | $75,654 | $18,000 | $57,654 |
| 2016 | $2,372 | $72,711 | $16,000 | $56,711 |
| 2015 | -- | $67,670 | $16,000 | $51,670 |
| 2014 | -- | $60,870 | $9,200 | $51,670 |
| 2013 | -- | $59,830 | $8,160 | $51,670 |
Source: Public Records
Map
Nearby Homes
- 405 Peachtree Dr
- 426 Peachtree Dr
- 206 White Bluff Dr
- 2410 Hodgeville Rd
- 111 Lakewood Dr
- 305 Sting Ray Ct
- 305 Kolic Helmey Rd
- 106 Saddle Ln
- 103 Kensington Cir
- 1679 Hodgeville Rd
- 460 Kolic Helmey Rd
- 209 Alyssa Ave
- 204 Alyssa Ave
- 440 Pecan Ln
- 104 Summer Station Dr
- 416 Moss Loop
- 103 Summer Station Dr
- 137 Summer Station Dr
- 109 Red Oak Ln
- 0 Hodgeville Rd Unit SA341541
- 115 Partridge Run
- 116 Hillside Dr
- 119 Hillside Dr
- 124 Partridge Run
- 122 Partridge Run
- 117 Hillside Dr
- 120 Partridge Run
- 113 Partridge Run
- 126 Partridge Run
- 114 Hillside Dr Unit 46
- 114 Hillside Dr
- 113 Hillside Dr
- 121 Partridge Run
- 0 Partridge Run Unit 9011493
- 111 Partridge Run
- 459 Peachtree Dr
- 128 Partridge Run
- 112 Hillside Dr
- 454 Peachtree Dr
- 118 Partridge Run
Your Personal Tour Guide
Ask me questions while you tour the home.