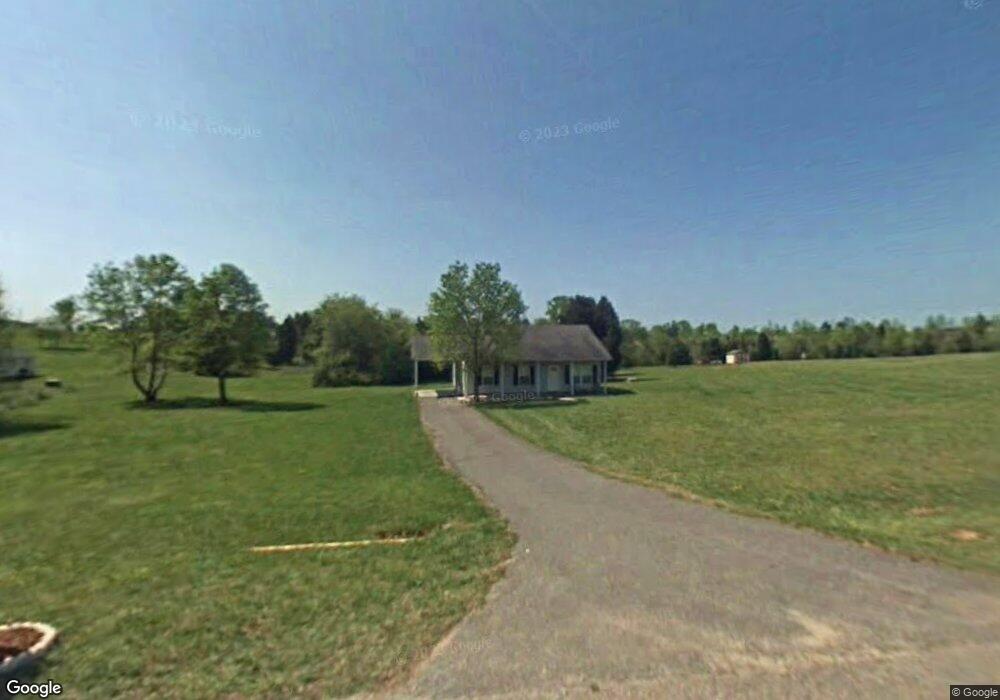
117 Plank Barn Ln Stony Point, NC 28678
Estimated Value: $207,000 - $235,000
3
Beds
2
Baths
1,080
Sq Ft
$204/Sq Ft
Est. Value
About This Home
This home is located at 117 Plank Barn Ln, Stony Point, NC 28678 and is currently estimated at $220,107, approximately $203 per square foot. 117 Plank Barn Ln is a home located in Iredell County with nearby schools including Scotts Elementary School, West Iredell Middle School, and West Iredell High School.
Ownership History
Date
Name
Owned For
Owner Type
Purchase Details
Closed on
Jun 13, 2013
Sold by
Jpmorgan Chase Bank Na
Bought by
Mcniel Charles F
Current Estimated Value
Purchase Details
Closed on
Jan 9, 2013
Sold by
Stikeleather Steven C and Stikeleather Jacquetta L
Bought by
Jpmorgan Chase Bank Na
Purchase Details
Closed on
Oct 31, 2007
Sold by
Okeefe Ted L and Stilwell Mary Lou
Bought by
Stikeleather Steven and Stikeleather Jacquetta L
Home Financials for this Owner
Home Financials are based on the most recent Mortgage that was taken out on this home.
Original Mortgage
$105,102
Interest Rate
6.27%
Mortgage Type
Purchase Money Mortgage
Purchase Details
Closed on
Mar 29, 1999
Sold by
Deal Brian E and Deal Tammy M
Bought by
Smith Troy J
Purchase Details
Closed on
Mar 1, 1995
Purchase Details
Closed on
Aug 1, 1988
Create a Home Valuation Report for This Property
The Home Valuation Report is an in-depth analysis detailing your home's value as well as a comparison with similar homes in the area
Home Values in the Area
Average Home Value in this Area
Purchase History
| Date | Buyer | Sale Price | Title Company |
|---|---|---|---|
| Mcniel Charles F | $62,500 | None Available | |
| Jpmorgan Chase Bank Na | $85,000 | None Available | |
| Stikeleather Steven | $103,000 | None Available | |
| Smith Troy J | $7,500 | -- | |
| -- | $4,000 | -- | |
| -- | $3,000 | -- |
Source: Public Records
Mortgage History
| Date | Status | Borrower | Loan Amount |
|---|---|---|---|
| Previous Owner | Stikeleather Steven | $105,102 |
Source: Public Records
Tax History Compared to Growth
Tax History
| Year | Tax Paid | Tax Assessment Tax Assessment Total Assessment is a certain percentage of the fair market value that is determined by local assessors to be the total taxable value of land and additions on the property. | Land | Improvement |
|---|---|---|---|---|
| 2024 | $880 | $138,960 | $11,250 | $127,710 |
| 2023 | $880 | $138,960 | $11,250 | $127,710 |
| 2022 | $725 | $106,010 | $11,250 | $94,760 |
| 2021 | $721 | $106,010 | $11,250 | $94,760 |
| 2020 | $721 | $106,010 | $11,250 | $94,760 |
| 2019 | $689 | $106,010 | $11,250 | $94,760 |
| 2018 | $663 | $102,220 | $11,250 | $90,970 |
| 2017 | $618 | $94,790 | $11,250 | $83,540 |
| 2016 | $618 | $94,790 | $11,250 | $83,540 |
| 2015 | $618 | $94,790 | $11,250 | $83,540 |
| 2014 | $540 | $89,630 | $9,000 | $80,630 |
Source: Public Records
Map
Nearby Homes
- 100 Springs Ct
- 290 Mill Hill Ct
- 61 Stony Point School Rd
- 116 Barnes Ln
- 201 Barnes Ln
- 1457 Smith Farm Rd
- 8170 Nc Hwy 90 E
- 4723 Old Mountain Rd
- 0 Old Mountain Rd Unit CAR4304814
- 115 Cherry Blossom Ln Unit 3
- 65 Shotwell Patterson Ln
- 163 Primrose Dr
- 48 Jeannes Ct
- 51 Rosemont Dr
- 329 Lindsey Farm Rd
- 568 Drumstand Rd
- 136 Ridge Run Dr
- 186 Blanche Ln
- 4501 Taylorsville Hwy
- 110 Burning Ln
- 125 Plank Barn Ln
- 0 Plank Barn Ln
- 639 W Lackey Farm Rd
- 108 Plank Barn Ln
- 129 Plank Barn Ln Unit 25
- 126 Plank Barn Ln
- 120 Taylor Estates Ln
- 118 Plank Barn Ln
- 633 W Lackey Farm Rd
- 116 Taylor Estates Ln
- 625 W Lackey Farm Rd
- 659 W Lackey Farm Rd
- 104 Taylor Estates Ln
- 140 Plank Barn Ln
- 634 W Lackey Farm Rd
- 624 W Lackey Farm Rd
- 136 Plank Barn Ln
- 671 W Lackey Farm Rd
- 5239 Taylorsville Hwy
- Beside 523 Taylorsville Hwy