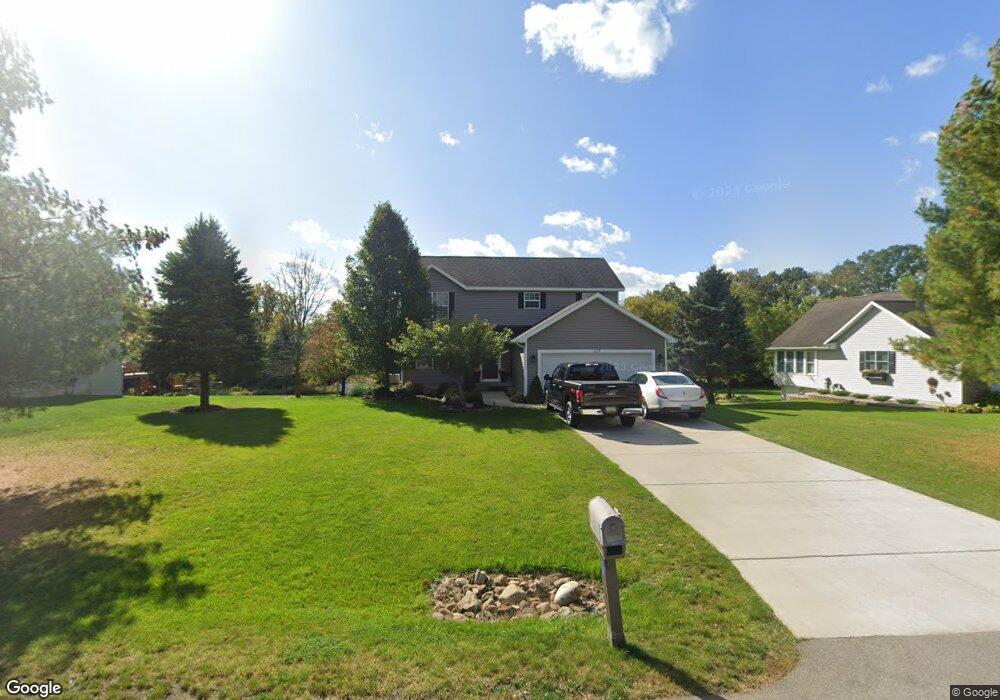
117 Remington Dr Unit 21 Dr Spring Arbor, MI 49283
Estimated Value: $322,500 - $403,000
3
Beds
3
Baths
2,080
Sq Ft
$174/Sq Ft
Est. Value
About This Home
This home is located at 117 Remington Dr Unit 21 Dr, Spring Arbor, MI 49283 and is currently estimated at $361,625, approximately $173 per square foot. 117 Remington Dr Unit 21 Dr is a home located in Jackson County with nearby schools including Western High School, Trinity Lutheran School, and Lumen Christi Catholic School.
Ownership History
Date
Name
Owned For
Owner Type
Purchase Details
Closed on
Aug 21, 2017
Sold by
Johnson Matthew W
Bought by
Rotich Herbert K and Rotich Rebekah J
Current Estimated Value
Home Financials for this Owner
Home Financials are based on the most recent Mortgage that was taken out on this home.
Original Mortgage
$176,000
Outstanding Balance
$147,135
Interest Rate
4.03%
Mortgage Type
New Conventional
Estimated Equity
$214,490
Purchase Details
Closed on
Nov 14, 2014
Sold by
Country View Estates Llc
Bought by
Johnson Matthew W and Johnson Laura M
Home Financials for this Owner
Home Financials are based on the most recent Mortgage that was taken out on this home.
Original Mortgage
$205,272
Interest Rate
3.91%
Mortgage Type
FHA
Purchase Details
Closed on
Jul 16, 2014
Sold by
Rothenberger Development Llc
Bought by
Cve Homes Llc
Create a Home Valuation Report for This Property
The Home Valuation Report is an in-depth analysis detailing your home's value as well as a comparison with similar homes in the area
Home Values in the Area
Average Home Value in this Area
Purchase History
| Date | Buyer | Sale Price | Title Company |
|---|---|---|---|
| Rotich Herbert K | $220,000 | Attorney | |
| Johnson Matthew W | -- | Attorney | |
| Johnson Matthew W | $209,060 | Mt Pleasan Abstract Title | |
| Country View Estates Llc | -- | Cnfc Title Agency | |
| Cve Homes Llc | $25,000 | None Available |
Source: Public Records
Mortgage History
| Date | Status | Borrower | Loan Amount |
|---|---|---|---|
| Open | Rotich Herbert K | $176,000 | |
| Previous Owner | Johnson Matthew W | $205,272 |
Source: Public Records
Tax History Compared to Growth
Tax History
| Year | Tax Paid | Tax Assessment Tax Assessment Total Assessment is a certain percentage of the fair market value that is determined by local assessors to be the total taxable value of land and additions on the property. | Land | Improvement |
|---|---|---|---|---|
| 2025 | $4,649 | $143,000 | $0 | $0 |
| 2024 | $2,737 | $134,800 | $0 | $0 |
| 2023 | $2,739 | $131,800 | $0 | $0 |
| 2022 | $4,222 | $126,600 | $0 | $0 |
| 2021 | $4,146 | $117,320 | $0 | $0 |
| 2020 | $3,932 | $100,440 | $0 | $0 |
| 2019 | $3,957 | $104,300 | $0 | $0 |
| 2018 | $4,153 | $107,310 | $12,030 | $95,280 |
| 2017 | $3,717 | $107,190 | $0 | $0 |
| 2016 | $2,351 | $106,230 | $106,230 | $0 |
| 2015 | $3,893 | $98,150 | $98,150 | $0 |
| 2014 | $3,893 | $11,850 | $0 | $0 |
| 2013 | -- | $11,850 | $11,850 | $0 |
Source: Public Records
Map
Nearby Homes
- 132 Remington Dr
- V/L S Dearing Rd Unit 40 Acres Vacant Land
- 392 Richard St
- 0 King Rd Unit 25060444
- 2503 Milford Rd
- 125 Burr Oak Dr
- 2926 S Sandstone Rd
- 1864 Chapel Rd
- 6051 Riverside Dr
- 8563 Mccain Rd
- 1570 Chapel Rd
- 3352 Reynolds Rd
- 1126 Chapel Rd
- 1001 N Dearing Rd
- 5427 Vrooman Rd
- 5162 Vrooman Rd
- 4920 Slayton Rd
- 4849 Indian Creek Dr Unit 6
- 28 Engelhardt Strasse
- 4540 Westbrook Dr Unit 45
- 117 Remington Dr
- 117 Remington - Lot 21 Dr
- 125 Remington Dr
- 109 Remington Dr Unit 22 Dr
- 109 Remington Dr
- 109 Remington - Lot 22 Dr
- 131 Remington Dr
- 105 Remington Dr
- 101 Remington - Lot 23 Dr
- 116 Remington Dr
- 148 Remington Dr Unit 7
- 148 Remington Dr Unit 7 Dr
- 148 Remington Dr
- 124 Remington Dr
- 124 Remington Dr Unit 105
- 108 Remington Dr
- 100 Remington - Lot #1 Dr
- 141 Remington Dr
- 100 Remington Dr Unit 1
- 100 Remington Dr Unit 1 Dr