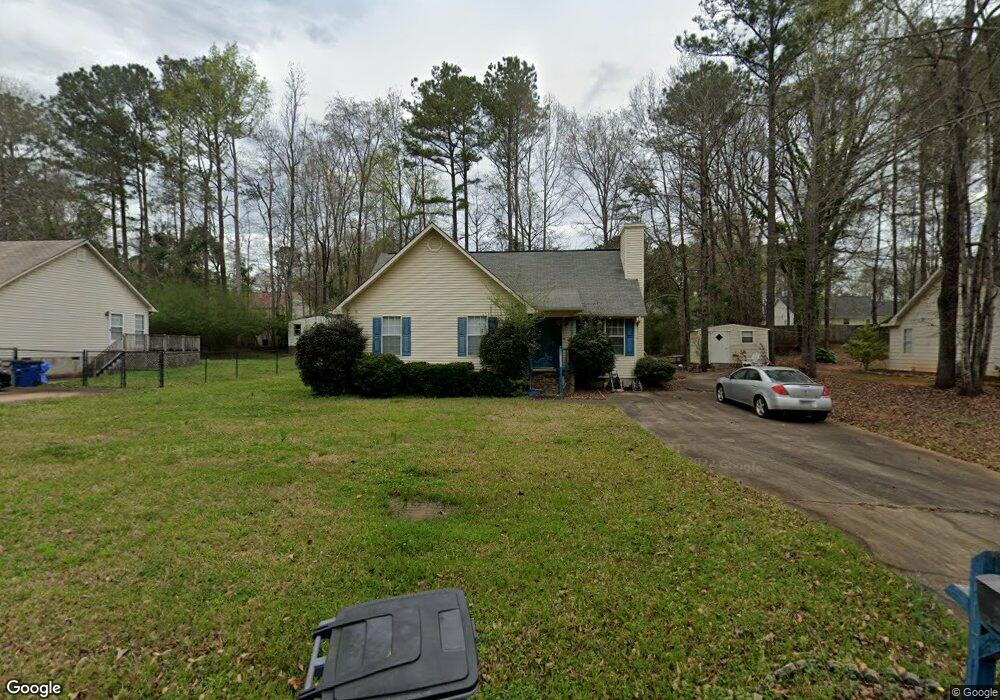
117 Ridgefield Cir Lagrange, GA 30241
Estimated Value: $199,000 - $210,000
3
Beds
2
Baths
1,080
Sq Ft
$190/Sq Ft
Est. Value
About This Home
This home is located at 117 Ridgefield Cir, Lagrange, GA 30241 and is currently estimated at $205,535, approximately $190 per square foot. 117 Ridgefield Cir is a home located in Troup County with nearby schools including Callaway Elementary School, Hogansville Elementary School, and Callaway Middle School.
Ownership History
Date
Name
Owned For
Owner Type
Purchase Details
Closed on
Oct 16, 2023
Sold by
Bradley Tami M
Bought by
Orantes Julia M
Current Estimated Value
Home Financials for this Owner
Home Financials are based on the most recent Mortgage that was taken out on this home.
Original Mortgage
$75,000
Outstanding Balance
$73,542
Interest Rate
7.18%
Mortgage Type
New Conventional
Estimated Equity
$131,993
Purchase Details
Closed on
Mar 13, 2023
Sold by
Bradley Tami M
Bought by
Orantes Julia M
Purchase Details
Closed on
Oct 17, 2001
Sold by
Timothy B Cindrick
Bought by
Bradley Tami M
Purchase Details
Closed on
Dec 19, 1997
Sold by
Nce Bf Thomaston Inc
Bought by
Timothy B Cindrick
Purchase Details
Closed on
Feb 29, 1996
Sold by
Spinks Brown Durand Inc
Bought by
Nce Bf Thomaston Inc
Purchase Details
Closed on
Aug 12, 1994
Bought by
Spinks Brown Durand Inc
Create a Home Valuation Report for This Property
The Home Valuation Report is an in-depth analysis detailing your home's value as well as a comparison with similar homes in the area
Home Values in the Area
Average Home Value in this Area
Purchase History
| Date | Buyer | Sale Price | Title Company |
|---|---|---|---|
| Orantes Julia M | -- | -- | |
| Orantes Julia M | -- | -- | |
| Bradley Tami M | $82,000 | -- | |
| Timothy B Cindrick | $69,000 | -- | |
| Nce Bf Thomaston Inc | -- | -- | |
| Spinks Brown Durand Inc | -- | -- |
Source: Public Records
Mortgage History
| Date | Status | Borrower | Loan Amount |
|---|---|---|---|
| Open | Orantes Julia M | $75,000 |
Source: Public Records
Tax History Compared to Growth
Tax History
| Year | Tax Paid | Tax Assessment Tax Assessment Total Assessment is a certain percentage of the fair market value that is determined by local assessors to be the total taxable value of land and additions on the property. | Land | Improvement |
|---|---|---|---|---|
| 2024 | $1,571 | $57,612 | $14,000 | $43,612 |
| 2023 | $1,566 | $57,404 | $14,000 | $43,404 |
| 2022 | $1,330 | $49,628 | $10,000 | $39,628 |
| 2021 | $1,154 | $40,236 | $8,000 | $32,236 |
| 2020 | $1,154 | $40,236 | $8,000 | $32,236 |
| 2019 | $865 | $30,680 | $8,000 | $22,680 |
| 2018 | $769 | $27,480 | $4,800 | $22,680 |
| 2017 | $769 | $27,480 | $4,800 | $22,680 |
| 2016 | $752 | $26,926 | $4,800 | $22,126 |
| 2015 | $754 | $26,926 | $4,800 | $22,126 |
| 2014 | $720 | $25,762 | $4,800 | $20,962 |
| 2013 | -- | $28,576 | $4,800 | $23,776 |
Source: Public Records
Map
Nearby Homes
- 125 Ridgefield Cir
- 105 Ridgefield Dr
- 121 Woodridge Cir
- 113 Woodridge Cir
- 224 Old Pond Rd
- 300 Old Pond Rd
- 207 Baileys Way
- 244 Old Pond Rd
- 456 Brookstone Dr
- 250 Old Pond Rd
- 509 Youngs Mill Rd
- 793 Celebration Blvd
- 112 Celebration Blvd
- 117 Celebration Blvd
- 129 Celebration Blvd
- 114 Crestwood Dr
- 227 River Meadow Dr Unit H14
- 231 River Meadow Dr
- 412 Sweetwood Ct Unit A36
- 517 Tradition Place
- 115 Ridgefield Cir
- 119 Ridgefield Cir
- 0 Ridgefield Cir Unit 7503630
- 0 Ridgefield Cir Unit 7373067
- 0 Ridgefield Cir Unit 8797808
- 0 Ridgefield Cir Unit 8604322
- 0 Ridgefield Cir Unit 7577525
- 0 Ridgefield Cir
- 113 Ridgefield Cir
- 121 Ridgefield Cir
- 106 Old Pond Rd
- 108 Old Pond Rd
- 110 Ridgefield Cir
- 108 Ridgefield Cir
- 111 Ridgefield Cir
- 104 Old Pond Rd
- 123 Ridgefield Cir
- 110 Old Pond Rd
- 114 Ridgefield Cir
- 106 Ridgefield Cir