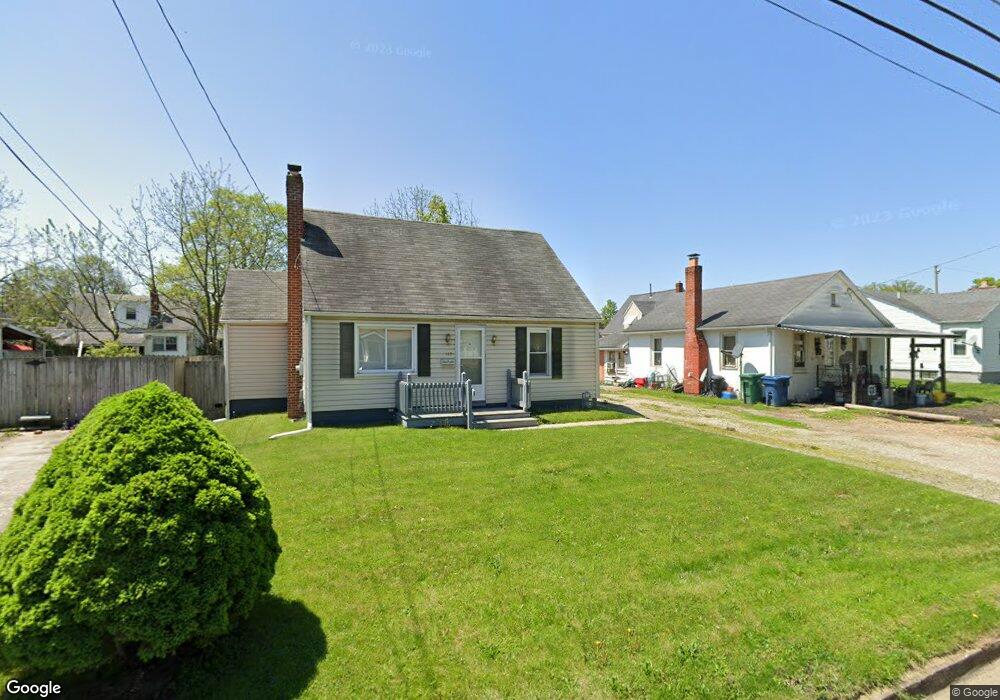
117 Ringold St Mount Vernon, OH 43050
Estimated Value: $142,236 - $192,000
3
Beds
1
Bath
1,072
Sq Ft
$156/Sq Ft
Est. Value
About This Home
This home is located at 117 Ringold St, Mount Vernon, OH 43050 and is currently estimated at $167,559, approximately $156 per square foot. 117 Ringold St is a home located in Knox County with nearby schools including Mount Vernon High School, St. Vincent de Paul School, and Christian Star Academy.
Ownership History
Date
Name
Owned For
Owner Type
Purchase Details
Closed on
Apr 4, 2011
Sold by
Harrod Robert Joe
Bought by
Harrod Bradley Joe
Current Estimated Value
Purchase Details
Closed on
Apr 5, 2010
Sold by
Midfirst Bank
Bought by
Secretary Of Hud
Purchase Details
Closed on
Mar 17, 2010
Sold by
Castle Roger J and Castle Betty D
Bought by
Midfirst Bank
Purchase Details
Closed on
Jul 26, 2005
Sold by
Secretary Of Hud
Bought by
Harrod Robert Joe and Harrod Family Trust
Purchase Details
Closed on
Jul 13, 2001
Sold by
Twigg Misty D
Bought by
Castle Roger J
Purchase Details
Closed on
Jan 23, 2001
Sold by
Twigg Roger L and Twigg Misty D
Bought by
Twigg Misty D
Purchase Details
Closed on
Aug 18, 1998
Sold by
Richmer Michael Andrew
Bought by
Twigg Roger L and Twigg Misty D
Purchase Details
Closed on
Jul 26, 1991
Sold by
Miller Samuel
Bought by
Richmer Michael Andrew
Purchase Details
Closed on
May 16, 1989
Sold by
Marietta Rodney W
Bought by
Miller Samuel
Purchase Details
Closed on
Sep 22, 1986
Sold by
Dowds Clarence F
Bought by
Marietta Rodney W
Create a Home Valuation Report for This Property
The Home Valuation Report is an in-depth analysis detailing your home's value as well as a comparison with similar homes in the area
Home Values in the Area
Average Home Value in this Area
Purchase History
| Date | Buyer | Sale Price | Title Company |
|---|---|---|---|
| Harrod Bradley Joe | -- | None Available | |
| Harrod Robert Joe | -- | None Available | |
| Secretary Of Hud | -- | None Available | |
| Midfirst Bank | $79,819 | None Available | |
| Harrod Robert Joe | $43,000 | None Available | |
| Castle Roger J | $69,900 | -- | |
| Twigg Misty D | -- | -- | |
| Twigg Roger L | $58,900 | -- | |
| Richmer Michael Andrew | $34,500 | -- | |
| Miller Samuel | $25,000 | -- | |
| Marietta Rodney W | $22,000 | -- |
Source: Public Records
Tax History
| Year | Tax Paid | Tax Assessment Tax Assessment Total Assessment is a certain percentage of the fair market value that is determined by local assessors to be the total taxable value of land and additions on the property. | Land | Improvement |
|---|---|---|---|---|
| 2024 | $1,263 | $32,630 | $5,680 | $26,950 |
| 2023 | $1,267 | $32,630 | $5,680 | $26,950 |
| 2022 | $1,137 | $26,110 | $4,550 | $21,560 |
| 2021 | $1,137 | $26,110 | $4,550 | $21,560 |
| 2020 | $1,101 | $26,110 | $4,550 | $21,560 |
| 2019 | $1,031 | $22,650 | $6,140 | $16,510 |
| 2018 | $1,033 | $22,650 | $6,140 | $16,510 |
| 2017 | $1,016 | $22,650 | $6,140 | $16,510 |
| 2016 | $943 | $20,970 | $5,680 | $15,290 |
| 2015 | $947 | $20,970 | $5,680 | $15,290 |
| 2014 | $952 | $20,970 | $5,680 | $15,290 |
| 2013 | $1,002 | $20,980 | $5,910 | $15,070 |
Source: Public Records
Map
Nearby Homes
- 108 Ringold St
- 600 1/2 E Chestnut St
- 600 E Chestnut St Unit 1/2
- 220 Coshocton Ave
- 213 Coshocton Ave
- 501 Oak St
- 418 E Pleasant St
- 419 E Pleasant St
- 1 Hilltop Dr
- 604 E Gambier St
- 655 Howard St
- 900 E Gambier St
- 104 N Park St
- 0 Miami St
- 612 N Clinton St
- 6 Edgewood Blvd
- 13 Eastgate Dr
- 208 E Burgess St
- 12 3rd Ave
- 12 Third Ave
Your Personal Tour Guide
Ask me questions while you tour the home.