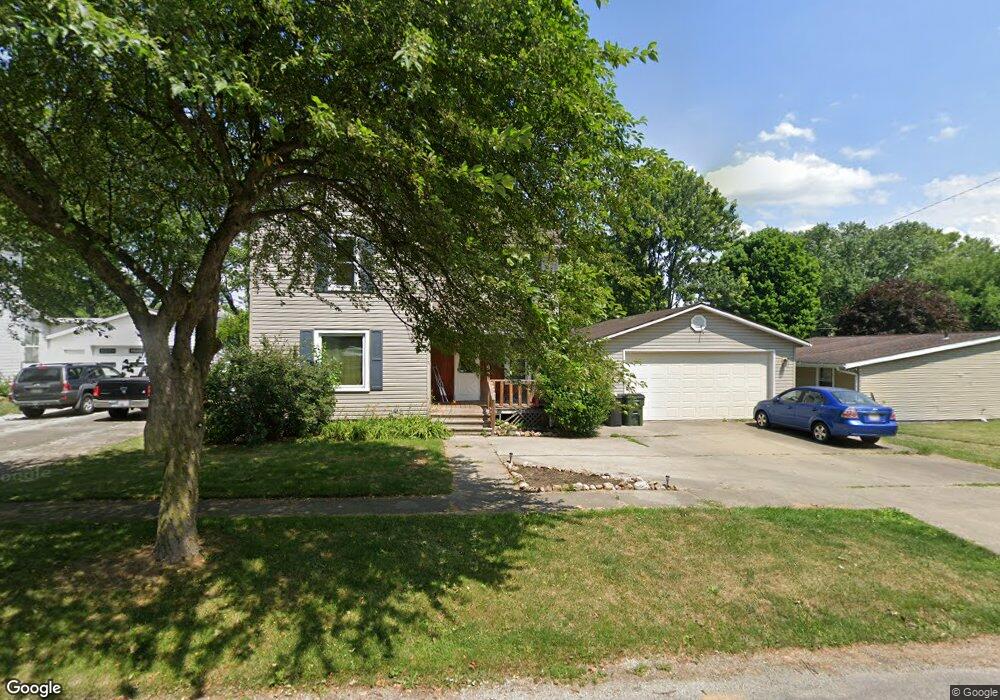
117 Russell Ave Creston, OH 44217
Estimated Value: $151,000 - $184,000
3
Beds
1
Bath
1,430
Sq Ft
$116/Sq Ft
Est. Value
About This Home
This home is located at 117 Russell Ave, Creston, OH 44217 and is currently estimated at $166,170, approximately $116 per square foot. 117 Russell Ave is a home located in Wayne County with nearby schools including Norwayne Elementary School, Norwayne Middle School, and Norwayne High School.
Ownership History
Date
Name
Owned For
Owner Type
Purchase Details
Closed on
Mar 13, 2025
Sold by
Winchell Jessica L
Bought by
Black River Ranch Llc
Current Estimated Value
Purchase Details
Closed on
Jan 27, 2019
Sold by
Winchell Stacy R and Winchell Jessica L
Bought by
Winchell Jessica L
Purchase Details
Closed on
Jan 28, 2000
Sold by
Rice Dewain R
Bought by
Winchell Stacy R and Winchell Jessica L
Home Financials for this Owner
Home Financials are based on the most recent Mortgage that was taken out on this home.
Original Mortgage
$64,350
Interest Rate
7.84%
Mortgage Type
New Conventional
Purchase Details
Closed on
Apr 15, 1991
Sold by
Sparks Douglas B and Sparks Mel
Bought by
Rice Dewain R and Rice Julia A
Purchase Details
Closed on
May 24, 1990
Sold by
Moore Timothy F and Moore Barbara
Bought by
Sparks Douglas B and Sparks Mel
Create a Home Valuation Report for This Property
The Home Valuation Report is an in-depth analysis detailing your home's value as well as a comparison with similar homes in the area
Home Values in the Area
Average Home Value in this Area
Purchase History
| Date | Buyer | Sale Price | Title Company |
|---|---|---|---|
| Black River Ranch Llc | -- | None Listed On Document | |
| Winchell Jessica L | -- | Nova Title Agency Inc | |
| Winchell Stacy R | $71,500 | -- | |
| Rice Dewain R | $47,700 | -- | |
| Sparks Douglas B | $40,000 | -- |
Source: Public Records
Mortgage History
| Date | Status | Borrower | Loan Amount |
|---|---|---|---|
| Previous Owner | Winchell Stacy R | $64,350 |
Source: Public Records
Tax History Compared to Growth
Tax History
| Year | Tax Paid | Tax Assessment Tax Assessment Total Assessment is a certain percentage of the fair market value that is determined by local assessors to be the total taxable value of land and additions on the property. | Land | Improvement |
|---|---|---|---|---|
| 2024 | $1,835 | $40,890 | $11,180 | $29,710 |
| 2023 | $1,835 | $40,890 | $11,180 | $29,710 |
| 2022 | $1,555 | $31,210 | $8,530 | $22,680 |
| 2021 | $1,415 | $31,210 | $8,530 | $22,680 |
| 2020 | $1,425 | $31,210 | $8,530 | $22,680 |
| 2019 | $1,471 | $32,080 | $8,510 | $23,570 |
| 2018 | $1,479 | $32,080 | $8,510 | $23,570 |
| 2017 | $1,416 | $32,080 | $8,510 | $23,570 |
| 2016 | $1,377 | $30,840 | $8,180 | $22,660 |
| 2015 | $1,396 | $30,840 | $8,180 | $22,660 |
| 2014 | $1,374 | $30,840 | $8,180 | $22,660 |
| 2013 | $1,415 | $30,890 | $7,380 | $23,510 |
Source: Public Records
Map
Nearby Homes
- 10368 Wooster Pike
- 147 N Main St
- 00 Sterling St
- 137 Forest View Ct
- 0 Burbank St
- 153 S Main St
- 5913 Stuckey Rd
- 154 Garden St
- 124 Garden St
- 14599 Eby Rd
- 5062 Catawba Place Ln
- 9376 Daniels Rd
- 5222 Greenwich Rd Unit 2
- 9372 Towpath Trail
- 129 Center St
- 6049 Valley Quail Ct
- 5833 Greenwich Rd
- 9252 Woodland Blue Dr
- 2961 Kestrell Ln
- 9248 Woodland Blue Dr
- 119 Russell Ave
- 115 Russell Ave
- 113 Russell Ave
- 121 Russell Ave
- 118 Maple Ave
- 120 Maple Ave
- 114 Maple Ave
- 116 Russell Ave
- 112 Maple Ave
- 114 Russell Ave
- 122 Maple Ave
- 118 Russell Ave
- 111 Russell Ave
- 112 Russell Ave
- 120 Russell Ave
- 110 Maple Ave
- 110 Russell Ave
- 109 Russell Ave
- 108 Maple Ave
- 107 Russell Ave