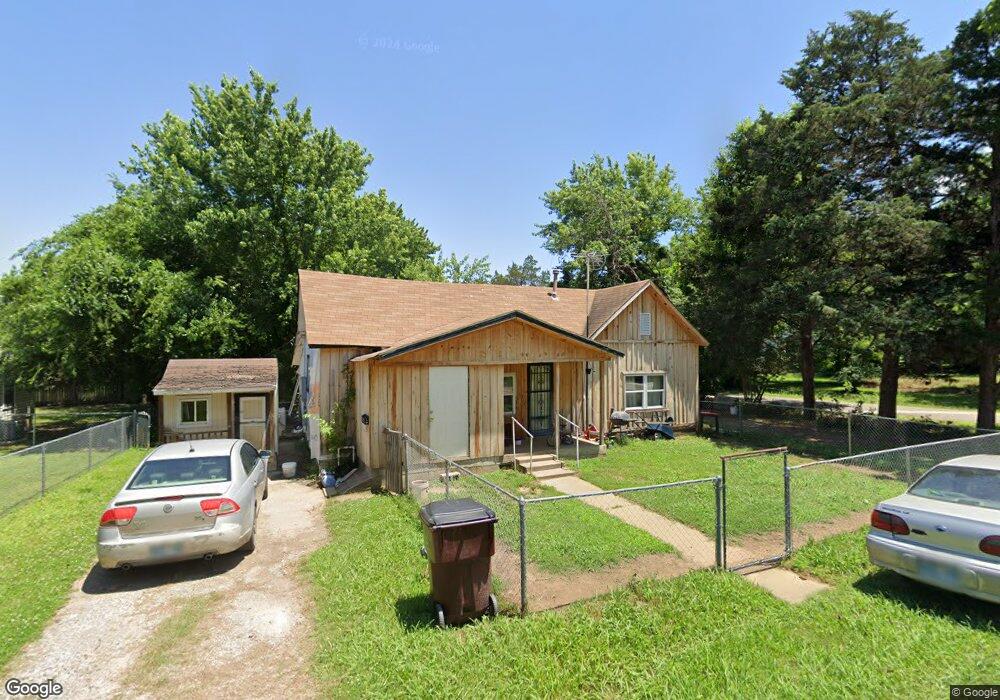
117 S 6th St Eufaula, OK 74432
Estimated Value: $96,000 - $114,000
3
Beds
1
Bath
912
Sq Ft
$113/Sq Ft
Est. Value
About This Home
This home is located at 117 S 6th St, Eufaula, OK 74432 and is currently estimated at $103,141, approximately $113 per square foot. 117 S 6th St is a home located in McIntosh County with nearby schools including Eufaula Elementary School, Eufaula Middle School, and Eufaula High School.
Ownership History
Date
Name
Owned For
Owner Type
Purchase Details
Closed on
Feb 28, 2022
Sold by
Rush and Sandra
Bought by
Rhine Clint Alex
Current Estimated Value
Purchase Details
Closed on
Oct 12, 2010
Sold by
Mckibben Tina
Bought by
Rush Paul and Rush Sandra
Home Financials for this Owner
Home Financials are based on the most recent Mortgage that was taken out on this home.
Original Mortgage
$16,000
Interest Rate
4.39%
Mortgage Type
Unknown
Purchase Details
Closed on
Nov 6, 2007
Sold by
Yeary David
Bought by
Mckibbem Tina
Purchase Details
Closed on
May 31, 2007
Sold by
Ccc Development Corp
Bought by
Yeary David and Mckibben Tina
Home Financials for this Owner
Home Financials are based on the most recent Mortgage that was taken out on this home.
Original Mortgage
$12,701
Interest Rate
6.42%
Mortgage Type
Unknown
Purchase Details
Closed on
Jan 22, 1999
Sold by
Day
Bought by
C C C Development
Create a Home Valuation Report for This Property
The Home Valuation Report is an in-depth analysis detailing your home's value as well as a comparison with similar homes in the area
Home Values in the Area
Average Home Value in this Area
Purchase History
| Date | Buyer | Sale Price | Title Company |
|---|---|---|---|
| Rhine Clint Alex | -- | None Listed On Document | |
| Rush Paul | $13,000 | None Available | |
| Mckibbem Tina | -- | None Available | |
| Yeary David | $16,000 | None Available | |
| C C C Development | $17,500 | -- |
Source: Public Records
Mortgage History
| Date | Status | Borrower | Loan Amount |
|---|---|---|---|
| Previous Owner | Rush Paul | $16,000 | |
| Previous Owner | Yeary David | $12,701 |
Source: Public Records
Tax History
| Year | Tax Paid | Tax Assessment Tax Assessment Total Assessment is a certain percentage of the fair market value that is determined by local assessors to be the total taxable value of land and additions on the property. | Land | Improvement |
|---|---|---|---|---|
| 2025 | $184 | $3,111 | $371 | $2,740 |
| 2024 | $176 | $3,111 | $360 | $2,751 |
| 2023 | $176 | $2,932 | $360 | $2,572 |
| 2022 | $96 | $2,163 | $360 | $1,803 |
| 2021 | $207 | $2,470 | $360 | $2,110 |
| 2020 | $207 | $2,470 | $360 | $2,110 |
| 2019 | $255 | $3,012 | $360 | $2,652 |
| 2018 | $251 | $3,012 | $360 | $2,652 |
| 2017 | $248 | $2,975 | $360 | $2,615 |
| 2016 | $237 | $2,834 | $360 | $2,474 |
| 2015 | $223 | $2,699 | $360 | $2,339 |
| 2014 | $221 | $2,699 | $360 | $2,339 |
Source: Public Records
Map
Nearby Homes
- 111 N 5th St
- 607 Sunset Strip Ave
- 509 Sunset Strip
- 800 W Grand Ave
- 403 W Grand Ave
- 213 S 4th St
- 309 W Foley St
- 58 Boardwalk
- 401 High St
- TBD Selmon Rd
- TBD Selmon Border Rd
- 411 S 3rd St
- 504 Woodland St
- 121 Gilbert Dr
- 87 Rose Way
- 115311 S 4237
- 0 Eufaula Sportsman St Unit 26
- 206 Forest
- 366 S Main St Unit 23
- 1104 Hilldale Dr
Your Personal Tour Guide
Ask me questions while you tour the home.